The Indian economy grew 7.7% in FY26. Its banking sector was the key driver of that growth, with ₹213.6 trillion in loans outstanding and credit growing 16.1% during the year. Bank credit is the primary transmission channel for economic activity, and the 2% acceleration over FY25 closely tracked the pickup across manufacturing, construction and services.
However, in FY27, that picture has dimmed somewhat. The RBI trimmed its FY27 GDP growth forecast to 6.6%, citing elevated energy prices and supply disruptions from the West Asia conflict, with a projected monsoon deficiency adding further downside risk to rural demand.
In FY27, credit growth is also expected to moderate to 13-15%, and with the credit-deposit ratio at 82%, the competition for deposits will be fierce as household savings increasingly flow toward mutual funds.
This blog covers FY26 performance across these segments, the divergence in profitability and efficiency between PSBs and private banks, and what the deposit constraint means for credit allocation in FY27.
Sectoral Breakdown of India’s Banking System
The RBI regulates the entire banking sector in India, which encompasses 12 public sector banks (PSBs), 21 private banks, 28 regional rural banks, 12 small finance banks, 5 payments banks, roughly 44 foreign banks, and a broad universe of NBFCs. The table below covers the core roles and limitations of each of the bank categories.
| Category | Count (Approx.) | Core role/ Specialisation | Key regulatory limitations |
|---|---|---|---|
| Public sector banks (PSBs) | 12 | Provide universal banking for retail, corporate, government and priority sectors. | These banks operate as universal banks with no prohibitions. |
| Private sector banks | 21 | Provide universal banking with greater emphasis on competitive products, technology and fee‑based services. | Same universal‑bank licence as PSBs are bound by all CRR/SLR, capital and exposure norms. |
| Regional rural banks | 28 | Rural and semi‑urban intermediation for agriculture and small enterprises. | Geographic footprint restricted to notified regions only.. |
| Small finance banks (SFBs) | 12 | Full‑service retail banks focused on small borrowers and financial inclusion. | Higher priority‑sector and "small loan" requirements. |
| Payments banks | 5 | Transaction and remittance platforms offering basic deposit and payment services for low‑income customers. | Cannot lend or take credit risk or even issue credit cards. |
| Foreign banks | ~44–45 | Provide trade finance, wholesale and investment‑banking services and niche wealth products. | Operate via branches or subsidiaries under RBI rules. |
| NBFCs (broadly) | Several hundred firms | Specialised lenders serving dedicated segments such as vehicle, housing, gold, microfinance etc, | Cannot accept demand deposits or issue cheques on themselves. |
It is also worth noting that the size distribution amongst the categories remains heavily skewed. PSBs account for roughly 59% of total banking assets, private banks account for around 37%, with foreign banks, SFBs and payments banks together making up the rest.
The next section evaluates the banking sector’s market performance and explores the underlying drivers that have shaped its trajectory in recent years.
Comparison of Banking Sub-Sector Performance Over The Years
We evaluate the performance of three major banking-related sub-sectors, NIFTY Bank, NIFTY PSU Bank and NIFTY Financial Services with the broader NIFTY-50. NIFTY Bank performance is driven by the private sector banks, with HDFC Bank (~18%), ICICI Bank (~14%) and Axis Bank (~10%) being the dominant constituents.
NIFTY PSU Bank is concentrated in Public Sector Banks (PSBs), dominated by SBI (~32%), PNB (~14%) and Canara Bank (~13%). NIFTY Financial Services, on the other hand, is more diversified, with banks, NBFCs, and insurers collectively shaping performance.
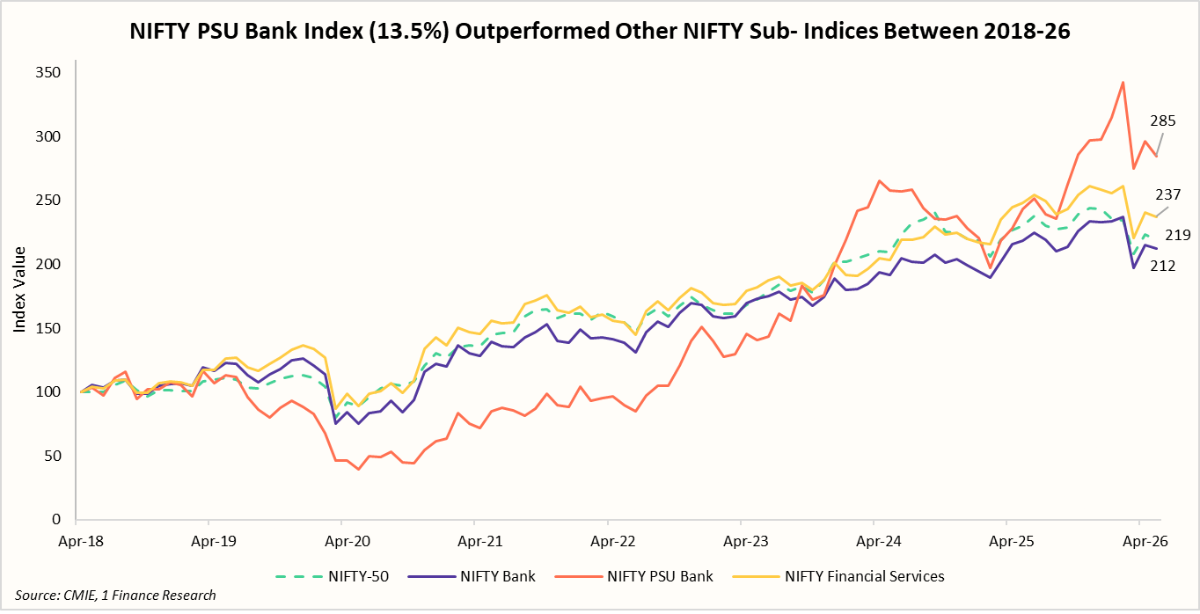
The chart shows that NIFTY PSU Banks (CAGR: +13.8%) have outperformed the other banking groups, such as NIFTY Financial Services (+10.8%), during the 8 years since Apr-18. On the other hand, NIFTY Bank (concentrated in private banks) lagged with 9.1%, trailing the benchmark NIFTY-50 (10.3%).
The valuations chart also tells a similar story. NIFTY PSU Bank trades well above its median Price-to-book value (P/B) ratio, after years of stronger earnings growth and a sharp decline in stressed assets.
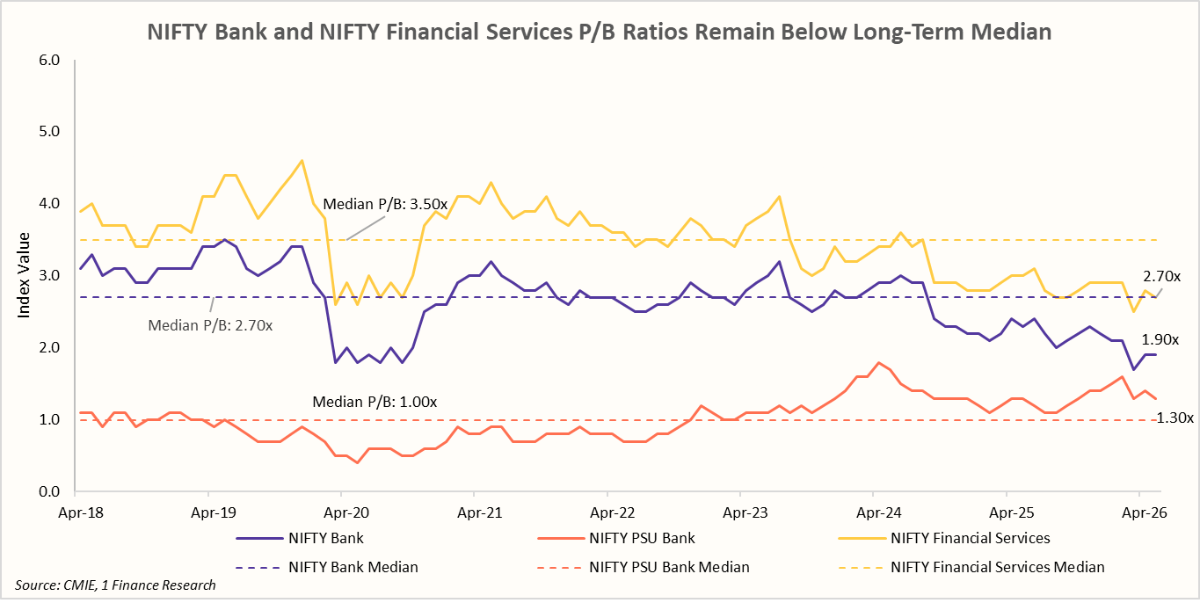
At the same time, NIFTY Bank and NIFTY Financial Services sub-indices continue to trade well below their long-term P/B medians.
PSB outperformance can also be understood by their share in the banking system and the improvement in profitability. PSBs control a significant share (~59%) of the banking system assets and have also seen an improvement in their Return on Total Assets (ROTA) from 0.3% (Mar-21) to 1.1% (Dec-25), narrowing the gap with private sector peers.
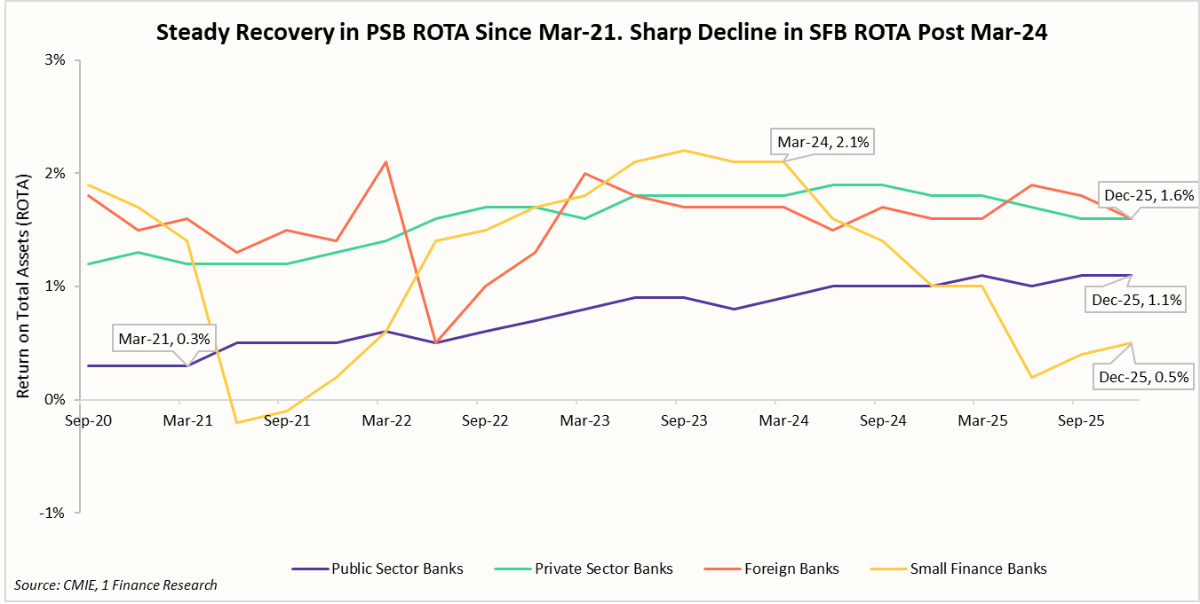
Private and foreign banks have consistently reported the highest ROTA, supported by stronger operating efficiency, superior asset quality and a greater focus on higher-yield lending segments. On the other hand, Small Finance Banks (SFBs) witnessed a sharp decline in profitability after Mar-24, with ROTA falling to ~0.5% (Dec-25), reflecting asset quality pressures in microfinance and unsecured lending portfolios.
Similarly, Private banks have traditionally had higher Net Interest Margins (NIMs) than PSBs, but the gap has also narrowed in FY26 as the repo-linked loan books for Private banks repriced down faster than PSB books following the 125 bps RBI's rate cuts.
A widely tracked indicator of bank health and asset-quality pressure is the Gross Non-Performing Assets (GNPA) ratio, which measures stressed loans as a share of total advances and has a direct bearing on credit costs. The chart below captures the significant improvement in this metric for PSB’s with GNPA falling from ~9.4% in Mar-21 to below 2.3% by Dec-25.
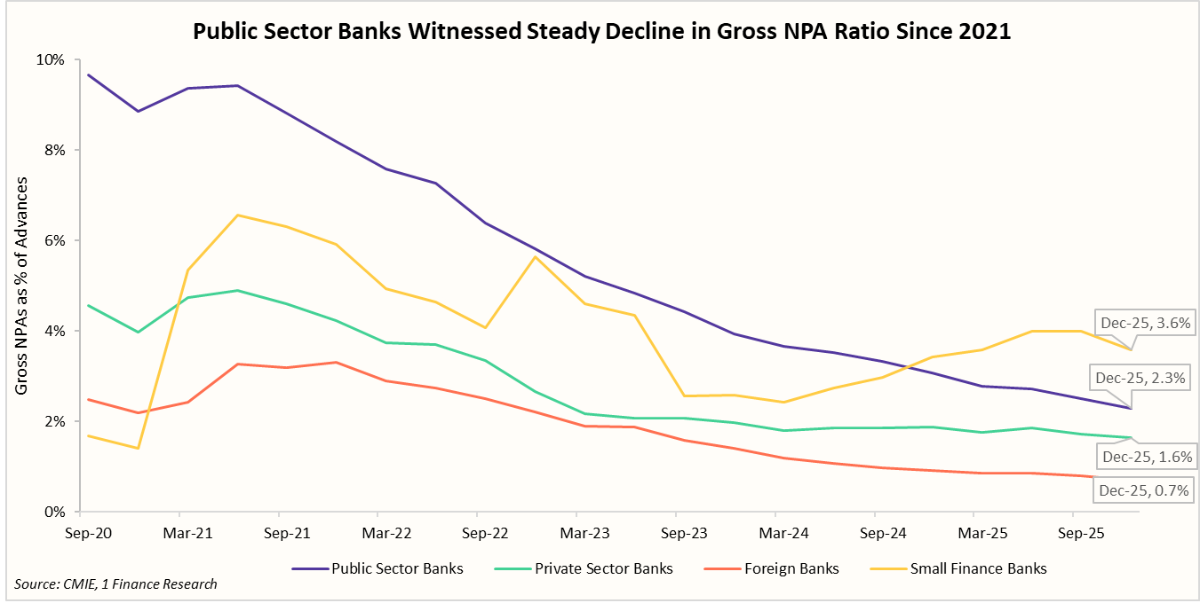
Private banks have also witnessed a steady improvement in asset quality. In contrast, Small Finance Banks have faced renewed asset quality pressures since 2024, with GNPA ratios trending higher and diverging from the broader sector-wide improvement.
While asset quality and profitability are measures of the sector's financial health, growth metrics offer insights into its ability to support new economic activity. The next section, therefore, shifts focus to trends in credit growth, deposit mobilisation, and the evolving credit-deposit balance across bank groups.
Credit and Deposit Growth Trends in the Banking Sector
Beyond balance sheet strength and profitability, the banking sector's ability to sustain growth depends on its capacity to mobilise deposits and extend credit. The evolution of credit growth, deposit growth, and the credit-deposit ratio therefore provides important insights into the sector's growth, funding dynamics, and the sustainability of the lending activity.
Credit growth accelerated between 2022 and 2024, driven by strong retail lending, healthier corporate balance sheets, and robust economic activity. Although growth has moderated from its peak levels, it remains above the pre-pandemic trends, indicating continued demand for credit from both households and businesses.
Deposit growth improved over the period but remained below credit growth for much of 2022–24. As households increasingly diversified savings towards market-linked investments, deposit mobilisation failed to keep pace with lending activity.
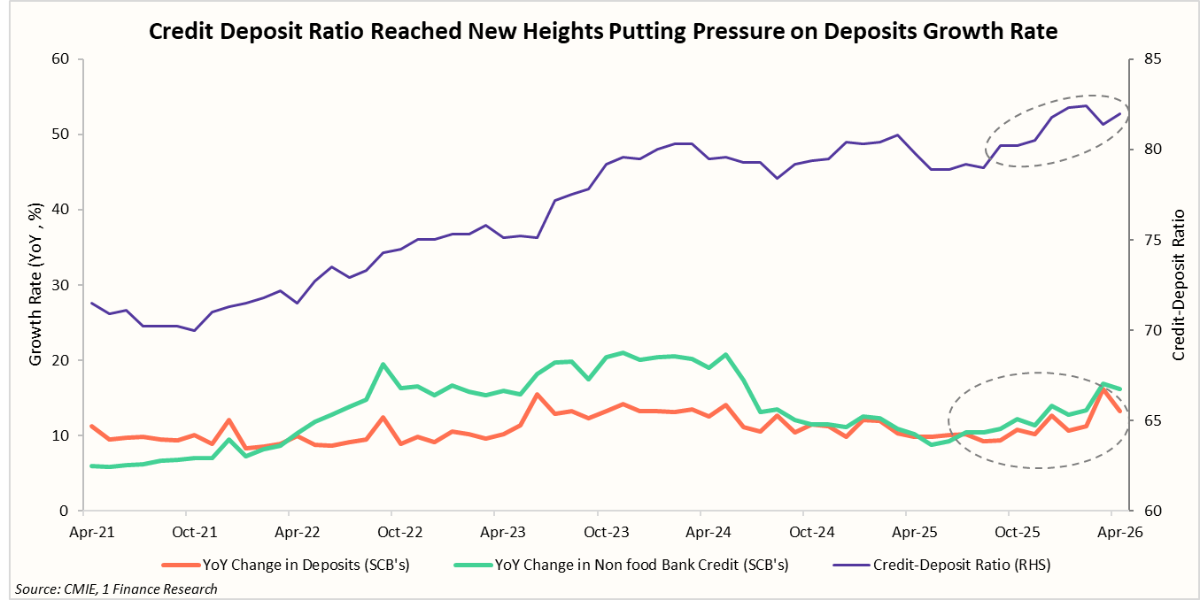
This imbalance contributed to a sustained rise in the Credit-Deposit ratio, which increased from 70% in Oct-21 to 82% in Feb-26. The rise was particularly pronounced among private sector banks, whose higher lending intensity pushed CD ratios well above those of PSBs, increasing their dependence on deposit mobilisation to fund future growth.
This has increased funding costs and could exert pressure on margins, especially if deposit growth continues to lag credit demand.
Looking ahead, the sector's ability to maintain healthy credit growth without further stretching funding conditions will depend on the pace of deposit mobilisation. This dynamic is likely to be one of the key themes shaping the banking sector's outlook in FY27.
FY27 Outlook for the Banking Sector
The banking sector entered FY27 with strong fundamentals. Against this backdrop, several macroeconomic factors, continuing from FY26, are expected to provide favourable support for credit demand and banking activity. The table below summarises the key growth tailwinds.
| Positive Macro Drivers | How it impacts the Banking Sector |
|---|---|
| 🟢Government capex and infrastructure spending | Sustained government and private sector spending on infrastructure projects expands the pool of bankable projects and corporate borrowers, driving credit demand across the economy. |
| 🟢Tailwinds from FY26 Rate cuts and tax cuts | Residual effects from last year's announcements are likely to continue feeding through into credit growth and fee income. |
| 🟢Credit deepening in underserved segments | India's credit-to-GDP ratio at 55% remains deeply underpenetrated vs. the global average of 148%, leaving a long runway for incremental lending in underserved sectors. |
At the same time, the sector faces an uncertain macro environment, with rising inflation and a delayed monetary easing path. A below-normal monsoon, as forecasted, may hurt rural incomes and increase stress in agriculture-linked and unsecured loan portfolios, creating fresh NPA risks and impacting overall profitability.
| Negative Macro Drivers | How it impacts the Banking Sector |
|---|---|
| 🔴 Below-normal monsoon Forecasts | A below-normal monsoon forecast, with El Niño conditions, can impact farm incomes, wages, and agricultural credit repayment capacity, affecting banks with rural or microfinance exposure. |
| 🔴Higher Energy Prices | Higher energy prices and input costs for commodities compress the margins for manufacturing and logistics borrowers, increasing the stress in the SME and corporate loan portfolios. |
| 🔴Structural migration of savings to mutual funds | With households redirecting savings away from bank deposits, the deposit base available to all banks has reduced, raising the cost of funds for banks. |
| 🔴Inflation | Higher inflation could delay monetary easing, keeping interest rates higher for longer, impacting credit demand and loan growth across the economy. |
Concluding Remarks
India’s banking sector entered FY27 from a position of considerable strength. Asset quality is at multi-year highs, profitability remains healthy, and capital buffers across most bank groups are adequate to support future growth. The sharp improvement in PSBs over the past few years has also reduced the performance gap between public and private sector institutions, creating a more balanced competitive landscape.
However, the key challenge for FY27 is unlikely to be the availability of credit demand but the availability of funding. Deposit growth has struggled to keep pace with lending activity, pushing the banking system’s credit-deposit ratio close to cycle highs. As households increasingly allocate savings towards mutual funds and other market-linked instruments, banks may need to compete more aggressively for deposits, potentially raising funding costs and compressing margins.
Against this backdrop, banks with strong deposit franchises, diversified lending portfolios, disciplined underwriting standards and superior operating efficiency are likely to be best positioned to navigate the evolving macroeconomic environment. While sector fundamentals remain favourable, the focus is gradually shifting from growth at any cost towards sustainable and well-funded growth.