

India's Economic Dashboard
India's Economic Dashboard
India's Economic Dashboard
India's Economic Dashboard

Economic Growth
A Snapshot of India's Economy
Monthly Report
August 2026 Monthly Report

Real GDP Growth
7.82% YoY
Q1 FY2026
Nominal GDP
10.33% YoY
Q1 FY2026
GVA - Overall
8.23% YoY
Q1 FY2026
GVA - Services
9.99% YoY
Q1 FY2026
GVA - Industry
7.68% YoY
Q1 FY2026
GVA - Agriculture
3.64% YoY
Q1 FY2026
GVA - Financial, Real Estate and Business Services
12.11% YoY
Q1 FY2026
Gross Fixed Capital Formation (GFCF)
11.95% YoY
Q1 FY2026
Government Consumption (GFCE)
4.33% YoY
Q1 FY2026
Private Consumption (PFCE)
7.14% YoY
Q1 FY2026
IIP- Overall
6.67% YoY
Jul, 2026
IIP- Manufacturing
7.33% YoY
Jul, 2026
IIP- Mining
-0.94% YoY
Jul, 2026
IIP- Electricity
8.71% YoY
Jul, 2026
IIP- Consumer Durables
10.46% YoY
Jul, 2026
IIP- Consumer Non-Durables
-1.04% YoY
Jul, 2026
IIP- 8 Core Industries
5.39% YoY
Jul, 2026
Capacity Utilisation
77.40% YoY
Q4 FY2025
HSBC Manufacturing PMI
52.80 pts
Aug, 2026
HSBC Services PMI
54.10 pts
Aug, 2026
Natural Gas Production
-3.48% YoY
Jul, 2026
Services Business Confidence
60.10% YoY
Q2 FY2026
Economic Phase
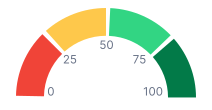

Index Value: 68.09
Trend Timeline
Track the economy's evolution throughout the year.
Strong Recovery signifies an acceleration in the pace of economic growth. In this phase, the economy continues to grow at a stronger rate, often influenced by low interest rates.
This Month
Check out upcoming releases
Stay ahead with key economic events


