

India's Economic Dashboard
India's Economic Dashboard
India's Economic Dashboard
India's Economic Dashboard

Equity Markets
A Snapshot of India's Economy
Monthly Report
August 2026 Monthly Report

NIFTY 50
23431.50 pts
9 Sep, 2026
NIFTY 50 P/E Ratio
19.80 x
9 Sep, 2026
NIFTY Bank
56295.55 pts
9 Sep, 2026
NIFTY Bank P/E Ratio
13.30 x
9 Sep, 2026
Foreign Portfolio Investments (FPIs) - Equity
$ 3.10 bn
Aug, 2026
Foreign Portfolio Investments (FPIs) - Debt
$ -0.20 bn
Aug, 2026
Gross Foreign Portfolio Investment (FPI)
$ 2.69 bn
Jun, 2026
Foreign Portfolio Investment in India
$ 2.69 bn
Jun, 2026
DIIs Investment - Equity
₹ 582.68 bn
Aug, 2026
Mutual Fund AUM
44.73% YoY
Aug, 2026
Mutual Fund AUM- Equity
₹ 38361.92 bn
Jul, 2026
Primary Issuances in Equity Market
₹ 781.08 bn
Aug, 2026
NIFTY FMCG P/E Ratio
31.40 x
9 Sep, 2026
NIFTY IT P/E Ratio
19.10 x
8 Sep, 2026
NIFTY Oil And Gas P/E Ratio
10.90 x
9 Sep, 2026
NIFTY Metal P/E Ratio
16.30 x
9 Sep, 2026
NIFTY Auto P/E Ratio
32.10 x
9 Sep, 2026
NIFTY Pharma P/E Ratio
41.30 x
9 Sep, 2026
NIFTY Midcap 150 P/E Ratio
28.80 x
9 Sep, 2026
NIFTY Smallcap 250 P/E Ratio
34.00 x
9 Sep, 2026
NIFTY Bank P/B Ratio
1.70 x
9 Sep, 2026
Economic Phase
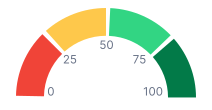

Index Value: 68.09
Trend Timeline
Track the economy's evolution throughout the year.
Strong Recovery signifies an acceleration in the pace of economic growth. In this phase, the economy continues to grow at a stronger rate, often influenced by low interest rates.
This Month
Check out upcoming releases
Stay ahead with key economic events


