

India's Economic Dashboard
India's Economic Dashboard
India's Economic Dashboard
India's Economic Dashboard

Fixed Income
A Snapshot of India's Economy
Monthly Report
August 2026 Monthly Report

G-Sec Yield Curve
7.11% YoY
9 Sep, 2026
10Y G-Sec Yield
6.96% YoY
9 Sep, 2026
G-Sec Yield Spread (1Y vs 3Y)
0.65 bps
1 Sep, 2026
G-Sec Yield Spread (1Y vs 5Y)
0.91 bps
1 Sep, 2026
G-Sec Yield Spread (1Y vs 7Y)
0.95 bps
1 Sep, 2026
G-Sec Yield Spread (1Y vs 10Y)
1.18 bps
1 Sep, 2026
G-Sec Yield Spread (1Y vs 15Y)
1.34 bps
1 Sep, 2026
AAA Bonds Yield Spread (1Y vs 3Y)
0.98 bps
2 Sep, 2026
AAA Bonds Yield Spread (1Y vs 5Y)
0.83 bps
2 Sep, 2026
AAA Bonds Yield Spread (1Y vs 10Y)
0.08 bps
31 Aug, 2026
AA Bonds Yield Spread (1Y vs 3Y)
-0.33 bps
2 Sep, 2026
AA Bonds Yield Spread (1Y vs 5Y)
-0.54 bps
2 Sep, 2026
AA Bonds Yield Spread (1Y vs 10Y)
0.07 bps
1 Sep, 2026
Credit Spread AAA vs G-Sec (1Y)
1.60 bps
2 Sep, 2026
Credit Spread AAA vs G-Sec (3Y)
1.40 bps
2 Sep, 2026
Credit Spread AAA vs G-Sec (5Y)
1.36 bps
2 Sep, 2026
Credit Spread AAA vs G-Sec (10Y)
0.76 bps
31 Aug, 2026
Economic Phase
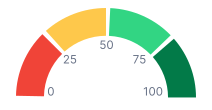

Index Value: 68.09
Trend Timeline
Track the economy's evolution throughout the year.
Strong Recovery signifies an acceleration in the pace of economic growth. In this phase, the economy continues to grow at a stronger rate, often influenced by low interest rates.
This Month
Check out upcoming releases
Stay ahead with key economic events


