

India's Economic Dashboard
India's Economic Dashboard
India's Economic Dashboard
India's Economic Dashboard

Trade & Currency
A Snapshot of India's Economy
Monthly Report
August 2026 Monthly Report

Merchandise Trade Balance
$ -31.98 bn
Jul, 2026
Exports - Manufactured Goods
$ 30.10 bn
Jun, 2026
Exports - Agricultural & Allied Products
$ 4.34 bn
Jun, 2026
Non-Oil Exports
$ 57.91 bn
Jul, 2026
Non-Oil Non-Gold Imports
$ 53.58 bn
Jul, 2026
Services Trade- Net Inflows
$ 17.65 bn
Jul, 2026
Current Account Deficit (% GDP)
-0.45% of GDP
Q1 FY2026
USD/INR Exchange Rate
₹95.15/$
9 Sep, 2026
Foreign Exchange Reserves
$ 740.80 bn
Aug, 2026
Import Cover (Months)
9.09 Months
Aug, 2026
Gross Foreign Direct Investment (FDI)
$ 3.48 bn
Jun, 2026
External Commercial Borrowings (ECBs)
74.42% YoY
Jun, 2026
Baltic Dry Index
2770.00 pts
Jul, 2026
Foreign Tourist Arrivals
6.60% YoY
Jun, 2026
Economic Phase
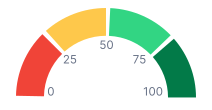

Index Value: 68.09
Trend Timeline
Track the economy's evolution throughout the year.
Strong Recovery signifies an acceleration in the pace of economic growth. In this phase, the economy continues to grow at a stronger rate, often influenced by low interest rates.
This Month
Check out upcoming releases
Stay ahead with key economic events


