Every major equity market fell when the Strait of Hormuz crisis hit in Feb- Mar 2026. Most markets have since recovered, and some even moved higher. India has not. That single divergence is the most important fact in global markets right now.
Among the major equity markets, South Korea’s KOSPI is up 47% year-to-date (YTD). Japan's Nikkei is up ~16%. The US market, despite conflict-related headwinds and relative underperformance from the “Magnificent Seven”, has reached new highs. India's Nifty 50, after correcting from its March trough, sits at -7% this year, the only major index which is still in the red.
This edition examines five markets that define the post-Hormuz landscape, what drove their recovery or the lack of it, and what each one means for how you should be thinking about global allocation right now.
| Key Takeaways |
|---|
| Major Global Equity Markets have recovered swiftly following the Strait of Hormuz crisis. South Korea (+47%) led the growth, followed by Taiwan (+27%), Brazil (+21%) and Japan (+16%). |
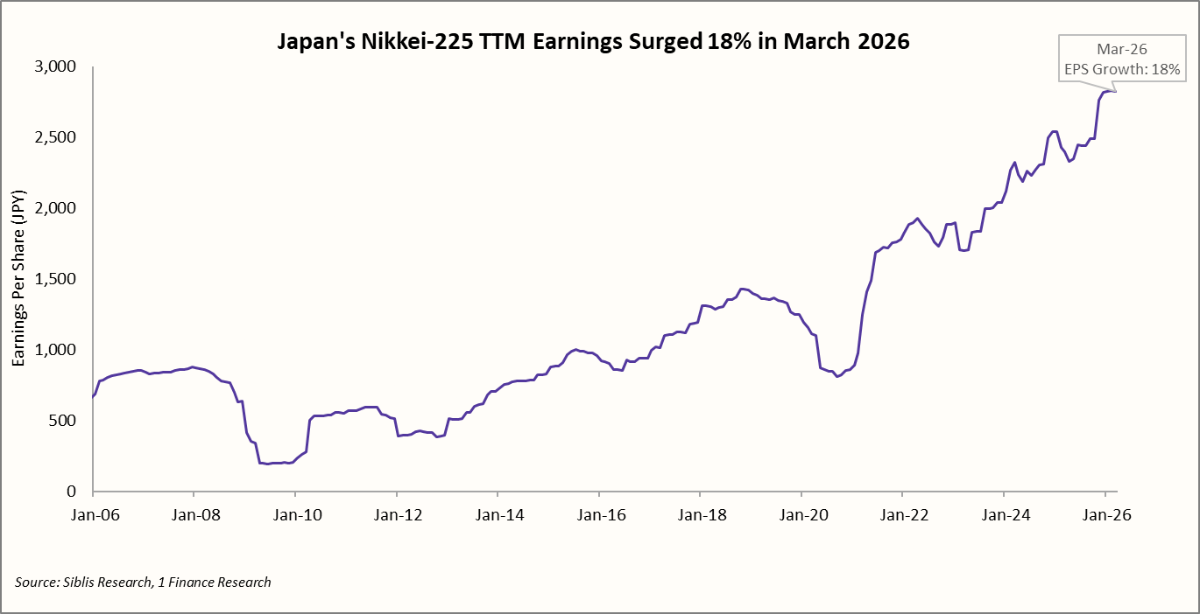
| Japan: EPS for Nikkei-225 grew ~18% in Mar-26, and has been a fundamental driver of performance. Corporate governance reforms and yen weakness are structural, which act as supporting tailwinds for Japanese equities. |
| South Korea: KOSPI has been the best-performing major market in the world today, powered by semiconductors and AI demand. The 36% consensus earnings growth forecast for 2026 is compelling, but the index remains dangerously concentrated. |
| United States: The S&P 500's earnings are growing steadily (~ 13%), and the narrow leadership within the index is showing signs of broadening. The risk related to higher valuation persists, which leaves little room for the AI capex cycle to disappoint. |
| United Kingdom: UK's FTSE 100 remains a low-volatility, high-dividend option with global revenue exposure. It is not a growth story. It is a stability-and-income story, appropriate for the defensive portion of an international allocation. |
| India: NIFTY-50 has been hit harder by the Hormuz-driven macro stress, due to India's crude oil price sensitivity, INR depreciation pressure, and FPI outflows. Q4 FY26 earnings will be the key inflection point. |
How The Global Markets Performed in Q1 2026
2026 opened on a fragile footing, with global growth expectations already softening before geopolitical risks escalated sharply following the Strait of Hormuz crisis and the Iran-US conflict in February 2026. Equity markets reacted swiftly, correcting across regions, but the drawdown proved short-lived as most major indices staged a sharp recovery within weeks.
The recovery has been highly differentiated across markets. The chart below captures the change in year-to-date (YTD) returns between 31 March and 17 April, isolating the rebound phase. South Korea (KOSPI) and Taiwan (TWSE) stand out with sharp positive revisions, indicating strong momentum during the recovery window. Brazil and Japan also saw meaningful improvement. In contrast, developed markets such as the UK (FTSE 100), Europe (STOXX 600), and the US (S&P 500) experienced only modest upward revisions, pointing to a far more muted rebound.
In contrast, developed markets such as the UK (FTSE 100), Europe (STOXX 600), and the US (S&P 500) experienced only modest upward revisions, pointing to a far more muted rebound.
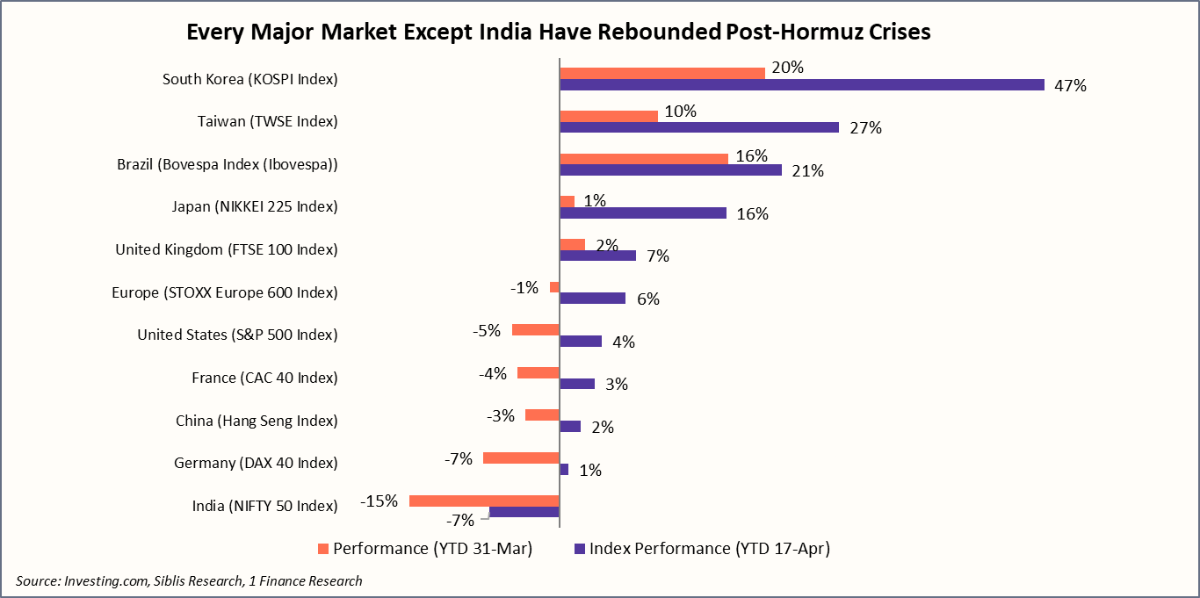
India has also been a clear laggard so far. The NIFTY 50 not only declined more sharply pre-crisis but has also failed to meaningfully participate in the recovery, highlighting relative underperformance in the current global cycle.
Let us now turn to a more granular assessment of some of the key markets, South Korea, Japan, the United States, the United Kingdom, and India, to examine the underlying drivers shaping their performance.A Closer Look at Key Global Markets
Japan
Among major developed markets, Japan stands out as a compelling opportunity in 2026. The Nikkei 225 has gained ~16% YTD, rebounding strongly after the Hormuz crisis and extending its 2025 gains (+26%). As the chart shows, index gains have been well- backed up by earnings growth, with TTM EPS rising ~18% as of March 2026, indicating a sustained upcycle.
A key driver of this rise has been ongoing corporate governance reforms in Japan, which have pushed firms to improve capital efficiency and enhance shareholder returns. Additionally, the sustained depreciation of Japanese Yen (JPY) has boosted exports, benefiting the globally oriented sectors such as automobiles and industrials.
For the rest of 2026, our outlook for Japan remains positive, with earnings growth supported by both corporate governance reforms and external demand. Japan’s trajectory in 2026 will depend on sustaining these structural improvements alongside a stable global macro environment.
Recommended for you
Readers also explored

As 2025 Wraps Up, What’s Next for Global Markets?
World GDP Breakdown 2025: Who Powers the Global Economy?
South Korea
Beyond the global popularity of K-dramas, South Korea also emerged as one of the strongest equity market performers in Q1-2026 (+47% YTD as of 17-Apr-26), building on its leadership in 2025 (+76% in 2025). The earnings trajectory of the leading benchmark index, KOSPI Composite, has been particularly compelling, with trailing twelve-month (TTM) EPS growth of ~29% in Mar-26 and ~54% in Mar-25.
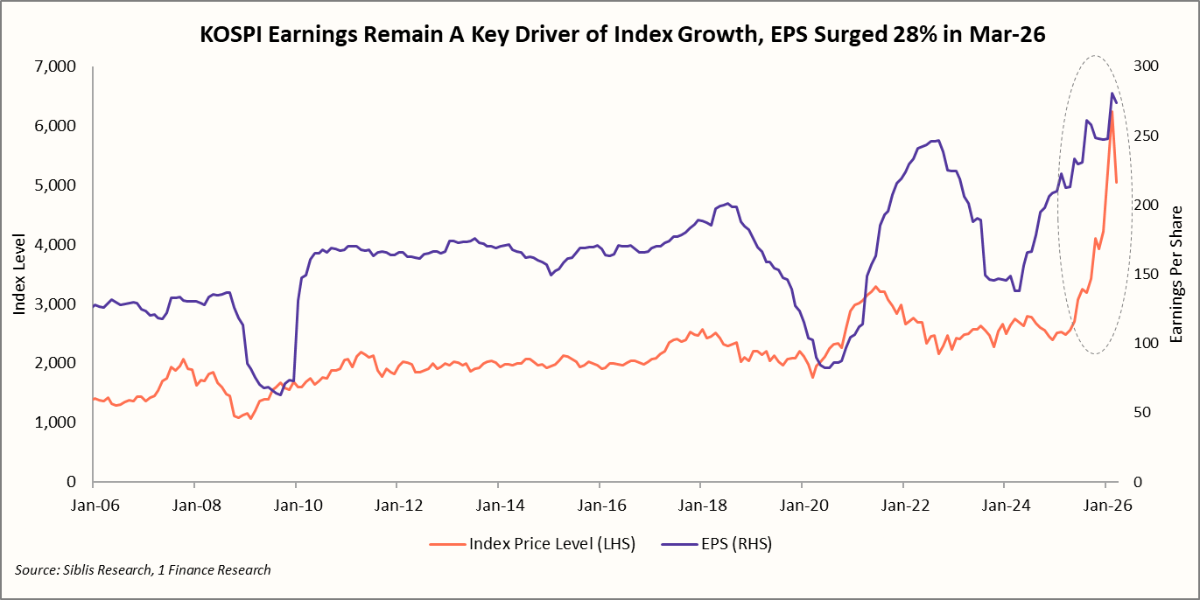
South Korea's rally is a semiconductor story at its core, but not exclusively. Memory pricing recovered sharply, inventory normalised, and AI-driven demand for high-bandwidth memory and data centre infrastructure created a structural demand layer that previous upcycles lacked.
But, beyond semiconductors, a broader corporate governance push mirroring Japan's reforms also improved capital efficiency across Korean conglomerates, adding a second engine to earnings growth that the market has only partially priced in.
However, this growth also introduced a key risk, of market concentration. The KOSPI Composite Index remains heavily skewed toward a handful of large-cap technology names. The consensus 2026 Earnings growth of ~36% remains strong, but any downturn in the semiconductor cycle or global tech demand could disproportionately impact index-level performance.
United States
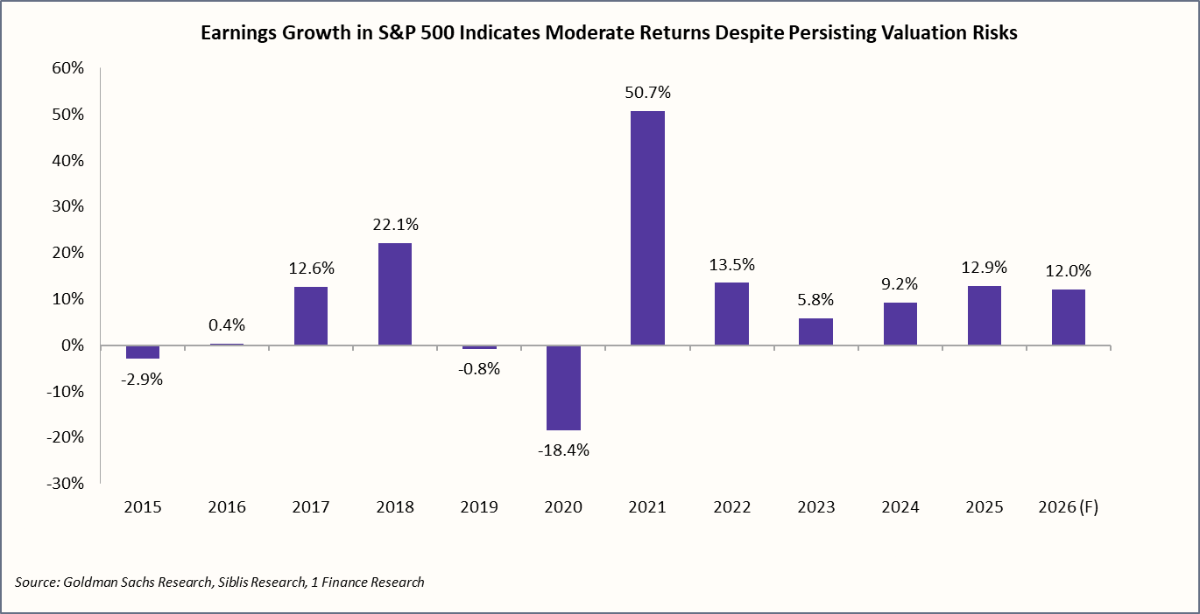
The S&P 500 dropped ~5% during the Hormuz crisis before attaining new highs in April 2026. The underlying earnings growth has justified that movement. As the chart shows, TTM EPS growth for S&P 500 companies has re-accelerated from 9.2% in 2024 to 12.9% in 2025, with a 2026 consensus forecast at 12.0%, sustaining the current levels.
Market leadership within the S&P-500 is also broadening, even if modestly. The mega-cap technology stocks, “Magnificent Seven” driving the S&P growth, have been relatively flat this year, growing a mere 0.4%, while the broader index grew ~ 4%.
Valuation concerns have eased somewhat. The S&P 500 is currently trading at a P/E of ~25x, placing it around the 80th percentile of its historical range. However, if earnings slow in the second half of 2026, the downside risk increases.
United Kingdom
The FTSE 100 has never been a growth story, and has never tried to be one. The UK’s domestic economy remains sluggish, with 2026 GDP growth forecasts revised down to around 0.8%. However, the index continues to offer stability, attractive valuations (PE: 15.6x vs. long-term Median PE 16.8x), steady dividends (~3.5%), and global diversification.
India
India has emerged as the clear outlier among global markets in Q1 2026, with the Nifty-50 declining ~14.5% by Mar-26 before partially recovering to ~-7% by mid-April. It remains the only major market yet to reclaim its January levels, reflecting a divergence from global peers.
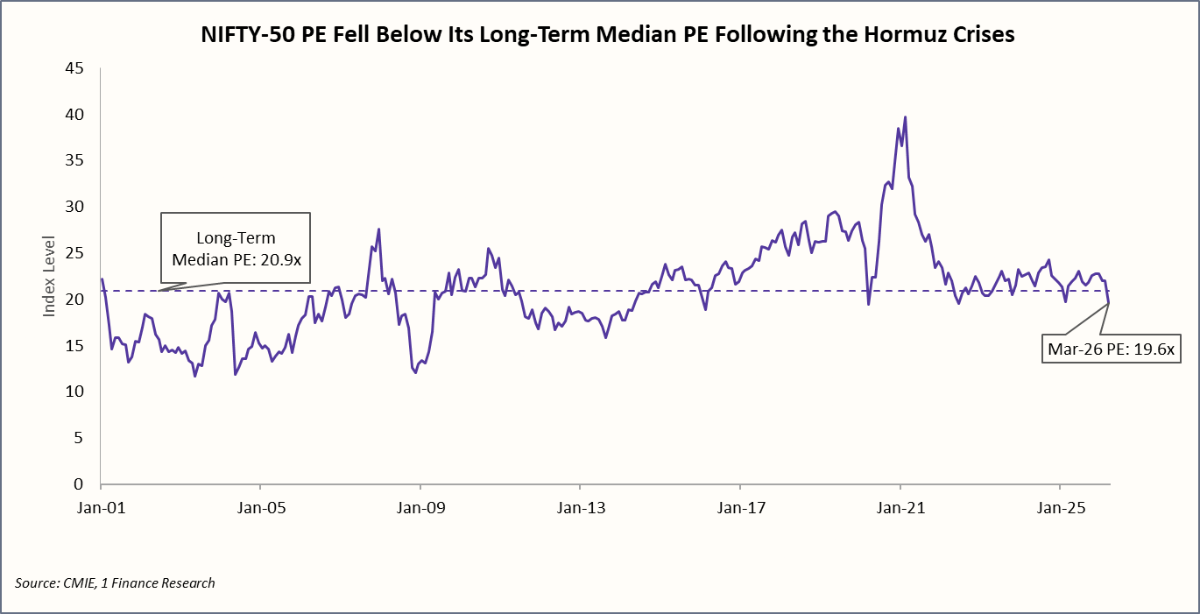
The chart below highlights the impact of the Hormuz crisis on Indian equities. Nifty’s PE has corrected sharply, falling below its long-term median PE (~20.9x) in Mar-26.
Despite this near-term slowdown, India’s broader growth story remains intact. Domestic consumption and public capex continue to anchor growth, supporting broader market strength across large, mid, and small caps. Q4 FY26 earnings, beginning mid-April, will be the first confirmation of how the stress factors emerging from the crude oil spike impacted the profitability at the firm level. That data point matters more than any macro call.
However, risks remain high due to India’s sensitivity to crude oil prices and persistent INR depreciation and global liquidity tightening, which could impact the profitability and earnings. The outlook is constructive, but contingent on earnings stability as well as the broader macro stability.
The Outlook for The Rest of 2026 and What It Means For You
As the fragile ceasefire between Iran and the US holds and talks continue, the region remains prone to flare-ups and further escalations. The V-shaped recovery that the equity markets witnessed post-crisis is pricing a diplomatic process that has not yet delivered a resolution.
South Korea, Japan, and the US enter Q2 2026 with a strong earnings outlook that can absorb geopolitical shocks. India needs stronger Q4 FY26 and Q1 FY27 earnings before the FII interest resumes. The UK, on the other hand, offers income stability but lacks growth.
For investors building global allocations, the principle for the next twelve months will be to prioritise markets driven by fundamentals over markets that are simply cheaper than they were.
Some major global events will be worth tracking closely. The Federal Reserve meeting in May will reveal whether the Fed views the oil shock as transitory or sticky. India’s Q4 FY26 earnings, due by May, will either confirm or extend the earnings contraction that is being projected in the aftermath of the Hormuz crisis. Also, the Brent crude price itself remains the single variable that connects every market in this analysis: it drives India’s current account, and also the global risk appetite simultaneously.
The past feels distant even when it’s recent, while the future seems secure, even though it isn’t. Human optimism triumphs, and markets follow. The recovery in global markets post Hormuz has been rapid, but it has not been equal, and that inequality is the point. Four of the five markets we examined are being driven by earnings growth, income yield, or structural reform.
India is the exception, waiting for the earnings confirmation that will allow the structural story to reassert. In global markets, that distinction, between markets carried by fundamentals and markets waiting for them, is the one that determines which recoveries compound and which ones stall.