India entered 2026 as the world's fastest-growing major economy. Then the West Asia conflict escalated, crude crossed $100, and the Nifty fell 10% in Mar-26. The question is whether that was a fundamental breakdown or a sentiment overcorrection. The data points firmly in one direction.
This blog examines what actually happened, the persistent FII outflows and the domestic flows that held firm against them, the valuation reset that has brought all three cap segments below their historical medians simultaneously, the Nifty 500 to gold ratio at a multi-year low, and the sectoral map that explains where the next leg of the recovery is likely to come from.
Key Takeaways
| Key Takeaways |
|---|
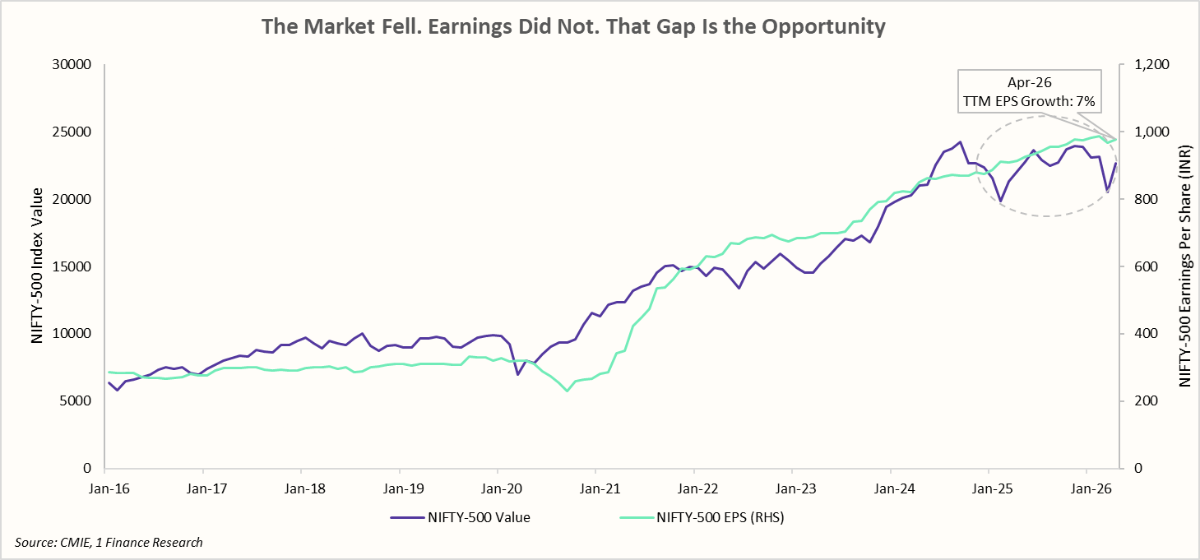
| Nifty-500 EPS grew 7% as of Mar-26 (TTM), even as the index is down by ~5% over the same period. This divergence stands out against a 98% correlation between index levels and earnings that has held for 30 years. |
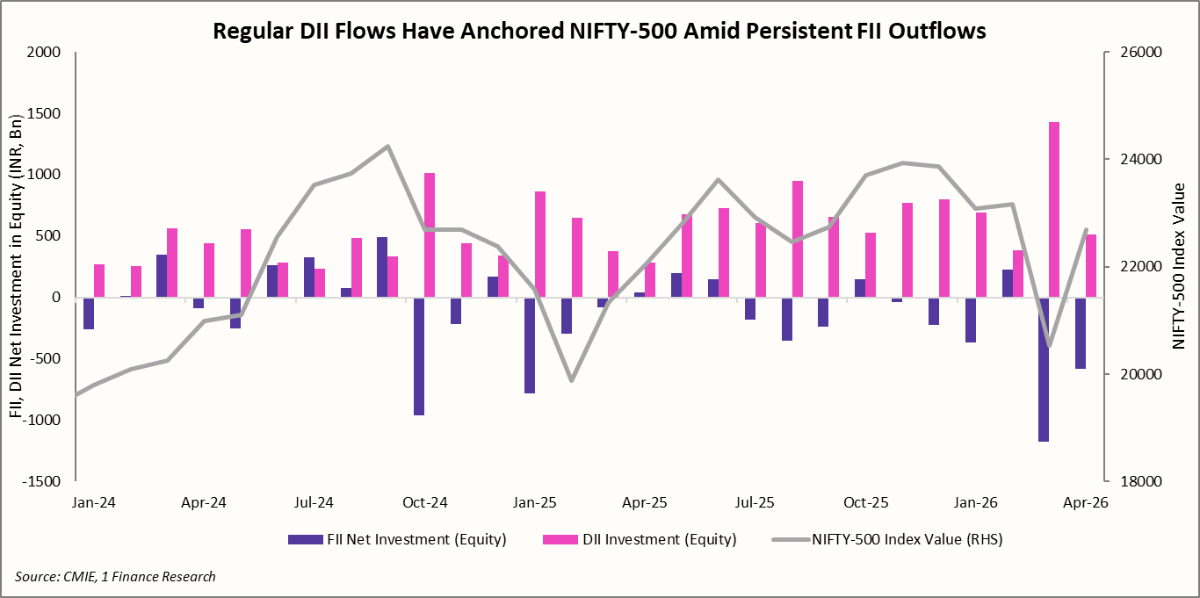
| Since Oct-24, FIIs have been persistent sellers driven by multiple triggers such as higher valuations, INR depreciation, rotation towards other EMs, and the Hormuz crises. DIIs have been persistent buyers, with record SIP inflows absorbing every selloff. |
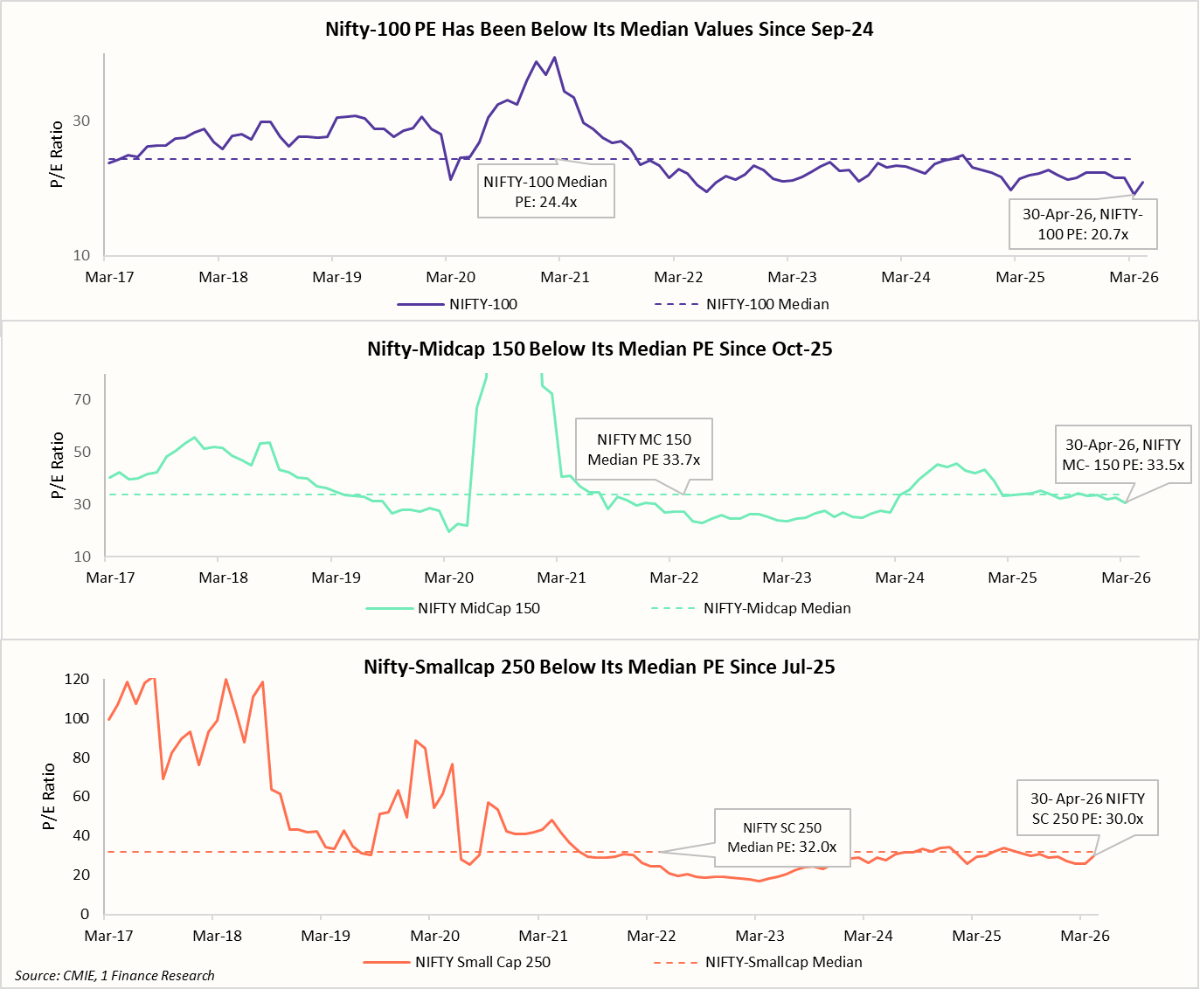
| All thre three market cap segments trade below their historical median P/E. Nifty-100 trades at 20.7x (median 24.4x), Midcap 150 at 33.5x (median 33.7x), and Smallcap 250 at 30.0x (median 32.0x). |
| The Nifty 500-to-gold ratio stands at 1.55x, compared to a 30-year median value of 2.50x. Every prior visit to this zone has been followed by a sustained equity recovery. |
| Among sectors, Metals led in 2025 (29.1%) and continue to lead in 2026 YTD (14.9%), with Energy (15.4%), the only other sector in positive territory. Auto (23.5% in 2025) and Bank (17.1% in 2025) have turned negative in 2026 YTD. |
India's Paradox of a Strong Economy and a Falling Market
India's FY26 macro story was a rare Goldilocks moment in a slowing world. Annual GDP growth well above 7% and annual headline inflation at just 2.1%, the lowest in decades, delivered exactly the combination that long-term capital looks for. Few emerging markets combine this pace of growth with this degree of macroeconomic stability.
Adding to that, a median age of 29 and a working-age population of over one billion continue to reinforce India’s long-term structural growth story. Monthly SIP inflows of ₹32,000 crore in Mar-26 reflect not just confidence in equities, but a maturing domestic investor base that increasingly sees market corrections as accumulation opportunities rather than exit signals.
Yet the markets briefly lost sight of that strength. The Nifty 500, a broader universe beyond the more familiar Nifty 50, is still down ~ 5% year-to-date1. It fell roughly 10% in Mar-26, its steepest single-month decline since the COVID crash of 2020, as the Hormuz crisis accelerated FII outflows that had already been running negative since October 2024.
On the other side, the trailing twelve-month (TTM) EPS for NIFTY 500 grew 7% as of Mar-26, and the 30-year correlation between index levels and earnings per share stands at 98%. The index and earnings have moved strongly together for three decades. The chart below captures the divergence precisely.
The FII selling that drove the correction traces back to Oct-24, when Indian equities were trading at elevated valuations, making it one of the most expensive among other emerging markets. This triggered a rotation of capital out of India and into relatively cheaper markets such as China and Brazil, where valuations were far more attractive and supported by policy stimulus expectations.
Persistent INR depreciation through the tariff episode in 2025 added another layer, quietly eroding USD returns even in months when the index held steady and making India increasingly unattractive for dollar-benchmarked funds.
In 2026, the rotation shifted again. The AI-driven semiconductor cycle drew fresh allocations toward South Korea and Taiwan, further reducing India's relative weight within the Emerging Market portfolio. The Hormuz crisis then delivered the sharpest and most concentrated outflow of the entire cycle in Mar-26.
Recommended for you
Readers also explored

Currency in Circulation: How Much Money Exists in the World?
India’s Unemployment Rate in 2025
Through every one of these episodes, domestic institutional investors held firm. DII flows absorbed each wave without structural damage, confirming that India's equity market is no longer set by foreign sentiment. It is set by domestic savings.
Yet not all of the segments recovered the same way in Apr-26, after the ceasefire between the US and Iran was announced. Mid and small-caps led the rebound, while the large-caps have lagged behind, reflecting where domestic investors chose to redeploy capital when the dust settled.
Despite the uneven recovery, valuations across all three segments remain below their long-term median P/E levels, an alignment that is signalling an attractive entry point.
Valuations tell one part of the story. The Nifty 500-to-gold ratio tells another one, measuring how Indian equities are priced relative to gold, the oldest safe-haven asset. Its 30-year median stands at 2.50x.
Every time this ratio approached the 1.3-1.5x range, equities went on to deliver strong forward returns. The trough in Sep-01 was followed by the powerful bull market between 2003–08, during which the ratio surged to new highs. Similarly, the Dec-11 bottom, shaped by the Eurozone crisis and gold’s supercycle rally, marked the beginning of another sustained recovery in Indian equities in 2012.
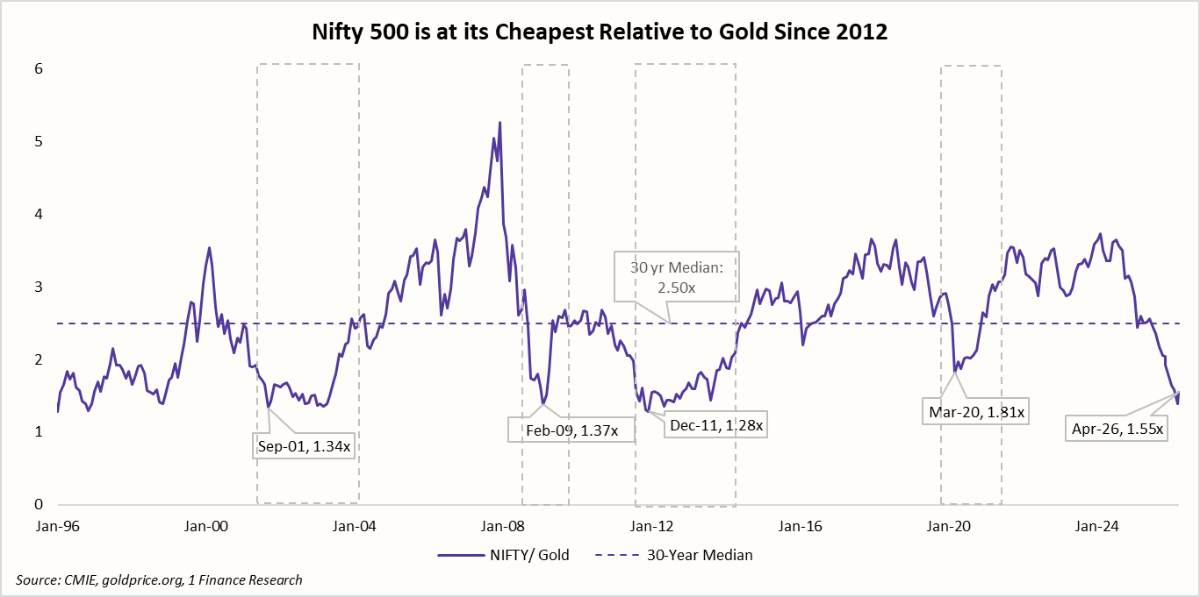
The COVID trough in 2020 was the most recent example. From those lows, the ratio recovered sharply alongside a strong rebound in the Nifty 500, which grew 116%. The current reading of 1.55x, down from nearly 3.7x in early 2024, marks one of the steepest declines in the chart’s history. Importantly, previous recoveries were driven by equities catching up rather than gold correcting lower.
The macro forces that drove the gold ratio to a 30-year low have also redrawn the sectoral performance map in 2025 and 2026.
Reading the Market's Shifting Preferences Across Business Sectors
The same macro forces that reshaped the index performance have been far more surgical at the sector level. Across major NIFTY sectors, gains in 2025 were driven by domestic cyclicals, with Metals leading at 29.1%, followed by Auto at 23.5% and Bank at 17.1%, driven by tax relief and rate cuts, rural recovery, and a broader revival in consumption.
IT and Realty sectors, down 12.6% and 16.6% respectively, were the only meaningful drags on the broader index.
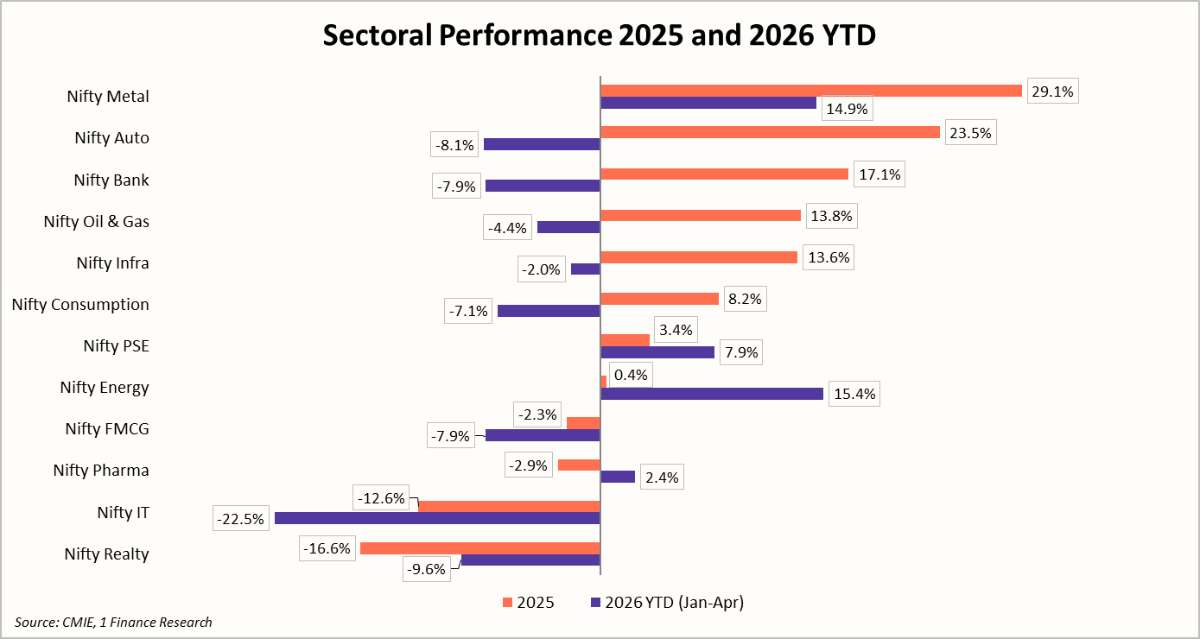
Four months into 2026, the picture has inverted almost completely. Energy at 15.4% and Metals at 14.9% are the only sectors in the positive territory, direct beneficiaries of higher crude prices and the safe-haven surge in precious metals.
The domestic cyclical sectors that led in 2025, Auto, Bank, and Consumption, are each down 7-8%, weighed down by the removal of the rate cut catalyst and rising input cost pressures.
Looking ahead, a correction in Crude oil prices towards $90 per barrel could rotate leadership back toward domestic cyclicals and consumption-driven sectors, but that catalyst remains conditional on geopolitical developments.
Concluding Remarks
Benjamin Graham, the father of value investing, wrote that in the short run, the market is a voting machine, but in the long run it is a weighing machine. What India's equity market has experienced since Oct-24 is precisely this: a sustained period of voting driven by flows, sentiment, and geopolitical shocks, while the underlying weighing machine, corporate earnings, credit growth, consumption, and demographic advantage, has continued its measured upward path.
Looking ahead, several near-term risks remain and should not be minimised. Crude prices, though retreating from their Hormuz peak, remain elevated and continue to weigh on margins across domestic sectors. A below-normal monsoon forecast poses another direct risk to consumption. Combined with persistent inflation risks, the RBI rate cut cycle remains on a pause, and FY27 consensus EPS growth has been trimmed from 14% to approximately 8% as a result.
But the investment case for India is a long-term one and also a structural one, built on a 98% earnings-to-index correlation over three decades, a demographic dividend adding over a million workers every month, bank credit growing at 16% (FY26), and an SIP engine that held firm at Rs 32,000 crore in Mar-26, the same month the market fell hardest. When the near-term noise fades, what remains is an economy still growing well over 6%, compounding through every cycle, and a domestic investor base that treats every correction as an opportunity.