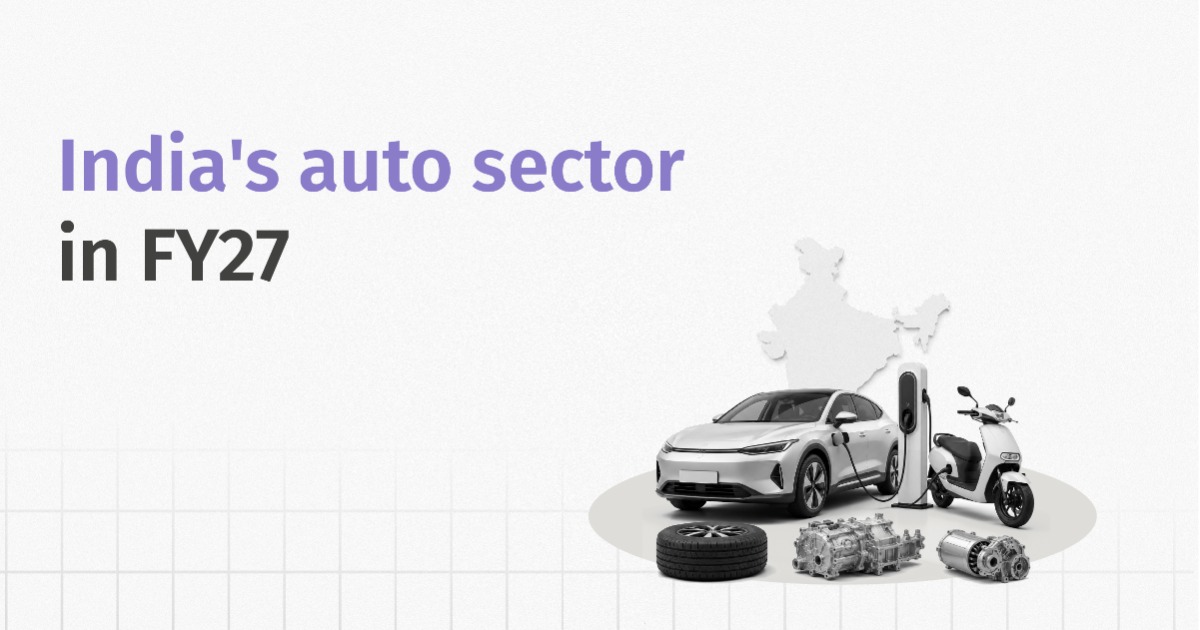
India's automobile industry is more than just a manufacturing powerhouse; it is one of the clearest real-time indicators of the economy. Two-wheeler sales reflect rural incomes and agricultural cash flows, passenger vehicle demand is an indicator of urban consumer confidence and discretionary spending, while commercial vehicle volumes reveal whether infrastructure investment is translating into freight movement and on-ground economic activity.
The sector as a whole contributes 7.1% to India's GDP and nearly 50% of the country's manufacturing GDP. It supports close to 30 million jobs across manufacturing, auto component suppliers, dealerships, vehicle financing, and after-sales services, making it one of the country's most economically significant industries.
Together, these segments respond to different economic drivers such as household incomes, interest rates, fuel prices, global supply chains, and monsoon conditions. The table below breaks down the sector into its constituent segments and briefly covers the macroeconomic drivers affecting the performance of each segment.
| Sub-sector | Share in Auto Sector | What It Covers | Macro Factors Affecting Demand |
|---|---|---|---|
| Automobiles | 75.2% | Two-wheelers, three-wheelers, passenger vehicles, and integrated OEMs that also make CVs |
|
| Auto Components | 21.0% | Engine parts, transmissions, electricals, castings, plus tyres and batteries; supplies OEMs, and the aftermarket. |
|
| Agricultural, Commercial & Construction Vehicles | 3.8% | Buses, trucks, tractors, and construction equipment makers |
|
At the aggregate level, the NIFTY Auto Index is the most representative proxy for the automobile sector, capturing the performance of leading vehicle manufacturers, auto component suppliers, tyre makers, and related businesses. To assess how the sector has performed relative to the broader equity market, we compare the performance of the NIFTY Auto Index with the NIFTY-50 since FY2019.
Auto Sector Performance Through the Years
The NIFTY Auto Index comprises 15 leading automobile and auto-component companies, making it a broad proxy for the sector's performance. Its composition is tilted mostly towards vehicle manufacturers, with M&M (23.2%), Maruti Suzuki (14.7%), Bajaj Auto (9.9%), and Eicher Motors (8.4%) making up the largest constituents.
Over the past 15 years (FY12-FY26), the NIFTY Auto Index outperformed the NIFTY-50 in 9 years, highlighting its ability to generate superior returns across economic upcycles. The sector has delivered stronger long-term wealth creation, with the index rising to 682 (Base 31-Mar-2011 =100) while the NIFTY-50 only rose to 404 during the same period.
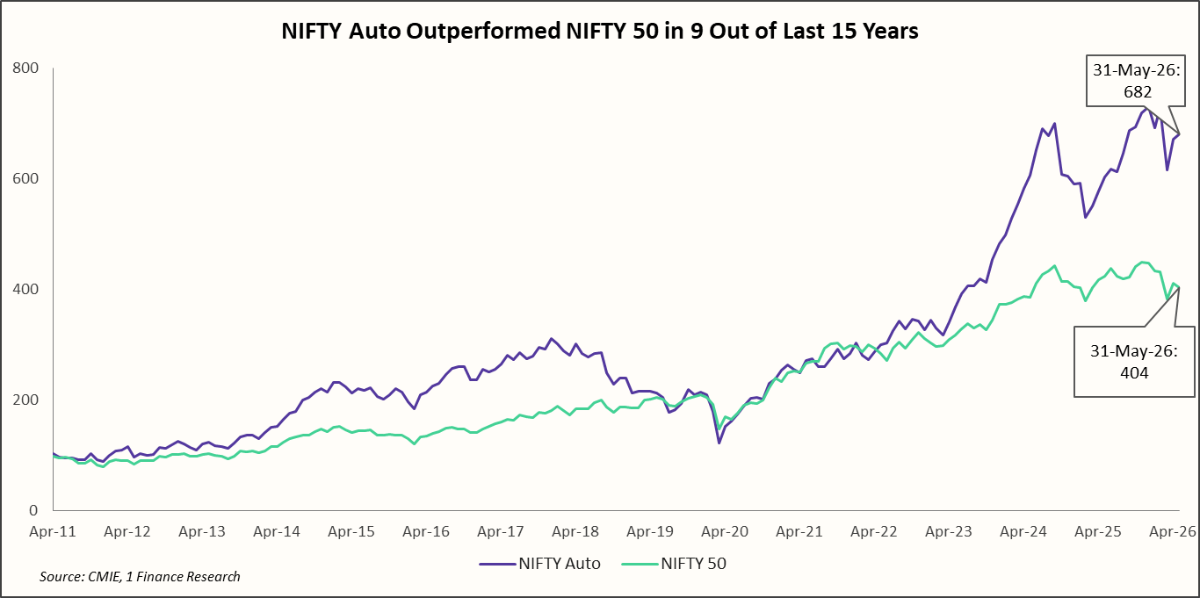
The automobile sector has historically exhibited pronounced cyclical swings, outperforming during periods of expansion and recovering sharply after downturns. NIFTY Auto significantly outpaced the NIFTY 50 between FY14 and FY18, supported by robust domestic demand, lower interest rates and improving macroeconomic conditions.
The sector then underperformed through FY18-FY20 as the NBFC liquidity crisis, slowing consumption, and the transition to BS-VI emission norms weighed on sales. A strong post-pandemic recovery from FY21 onwards once again propelled the index ahead of the broader market.
The latest phase of outperformance began in FY26 (NIFTY Auto and continues into FY27, supported by policy announcements like the RBI rate cuts, GST rationalisation, and personal income tax relief. These measures improved the outlook for vehicle demand across all segments, while investors priced in a stronger earnings cycle for the entire sector.
Over the long-term, NIFTY Auto has been a high-beta sector (β= 1.13x since inception), amplifying broader market moves. However, its 5-year beta (Jul-21 - Jun-26) of 0.94x suggests relatively lower sensitivity during the post-pandemic recovery period.
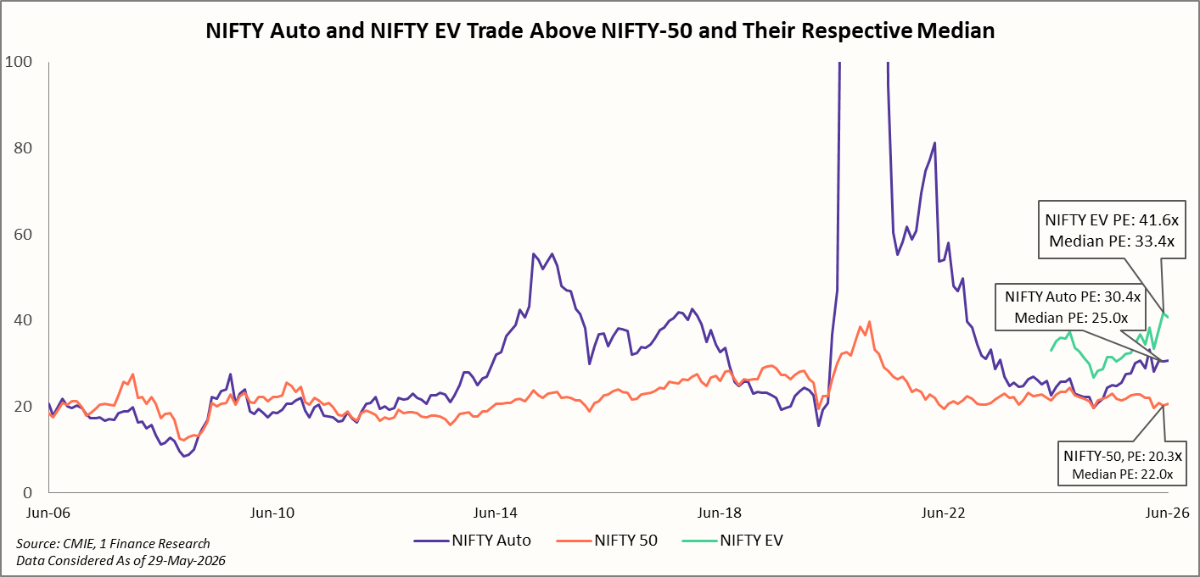
Next, comparing the valuations, NIFTY Auto Index has historically traded at a premium to the broader NIFTY-50, reflecting investors' expectations of stronger earnings growth, rising vehicle penetration, premiumisation trends, and long-term mobility demand.
As of Jun-26, the NIFTY Auto index trades at 30.4x, well above the NIFTY-50's 20.3x and also above its own long-term median of 25.0x. The recently launched NIFTY EV & New Age Automotive Index trades at a steeper valuation of 41.6x compared with its median 33.4x, highlighting optimism towards electric mobility and emerging automotive technologies.
However, the index has a limited performance history, making long-term valuation comparisons less reliable than those of the more established NIFTY Auto Index.
To better understand the drivers behind the sector's performance, it is important to examine the automobile sub-sector, which accounts for over 75% of the industry's market capitalisation.
Domestic Vehicle Sales and Auto Exports in Recent Years
In this section, we compare unit sales, which offer a more direct view of underlying mobility demand than rupee revenues, which can be skewed by price increases or premiumisation. In FY26, India’s auto industry recorded 2.8cr domestic unit sales, up 10.4% vs FY25, with growth across major segments, Passenger vehicles, which includes cars, vans and utility vehicles (PVs), two-wheelers (2Ws), three‑wheelers (3Ws) and commercial vehicles (CVs).
When viewed over the longer term, PVs remain the auto sector’s clear growth engine. Since FY18, PV sales have grown the fastest among all segments, with Mar-26 levels about 60% above Mar-18, supported by rising incomes, stronger UV preference, premiumisation and easier retail financing.
Till FY25, the post-COVID recovery was uneven: PVs (141) had already moved well ahead, while 2Ws (90), 3Ws (113) and CVs (128) were still below, or modestly above, their Mar-18 levels. This shows that mass-market and commercial segments took longer to normalise, held back by weak rural demand, higher ownership costs and slower replacement cycles.
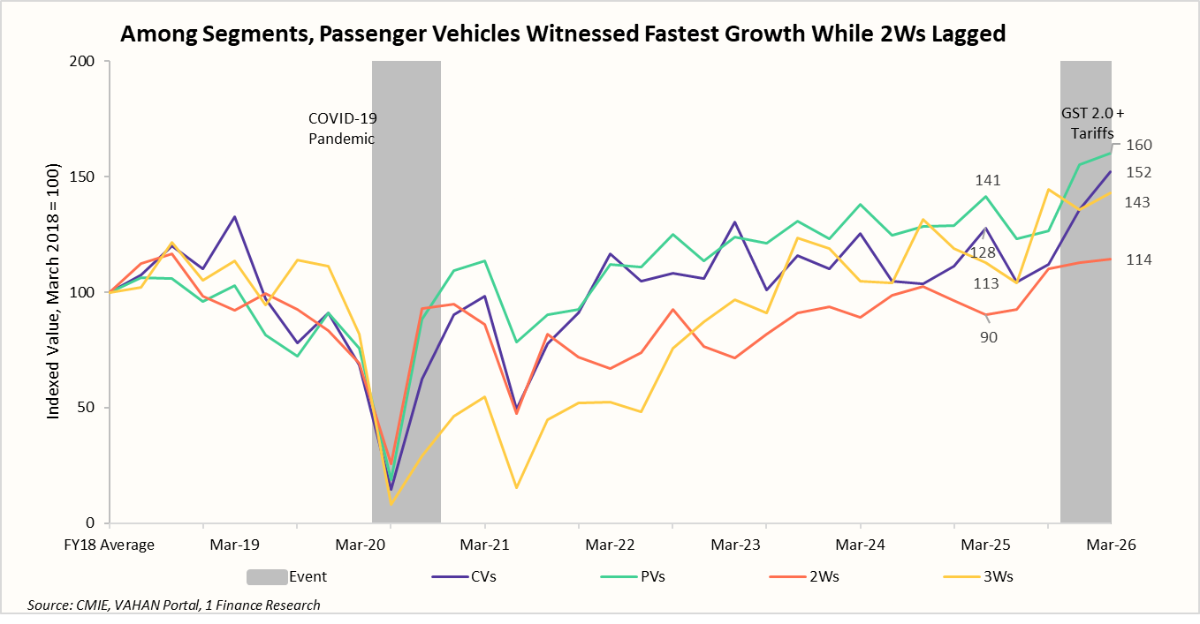
FY26 marked a broad-based recovery for the entire sector, with every major vehicle segment recording strong growth. Three-wheelers (+12.8%) and commercial vehicles (+12.6%) led the expansion, followed by two‑wheelers (+10.7%) and passenger Vehicles (+7.9%). The strong performance of CVs and 3Ws is particularly encouraging, as it points to improving freight movement, last-mile connectivity and underlying economic activity.
The momentum strengthened further in the second half of FY26. GST 2.0 reforms, lower borrowing costs and inflation improved affordability, driving a sharp pickup in demand from the Dec-25 quarter onwards. Over the Dec-25 and Mar-26 quarters combined, sales rose 21.5% for 2Ws, 20.3% for CVs, 20.2% for 3Ws and 16.7% for PVs, indicating that the recovery had broadened well beyond the premium PV segment.
Export trends present a markedly different picture from the domestic market. While PVs remain the primary driver of domestic demand, automotive exports are increasingly led by 2Ws. By Mar-26, 2W exports had nearly doubled relative to their Mar-18 levels, substantially outperforming 3Ws (+25%), PVs (+20%) and CVs (+10%).
Strong demand from Africa, Latin America, South Asia and ASEAN, coupled with India's cost-competitive manufacturing base, has reinforced its position as a global supplier of affordable motorcycles and scooters.
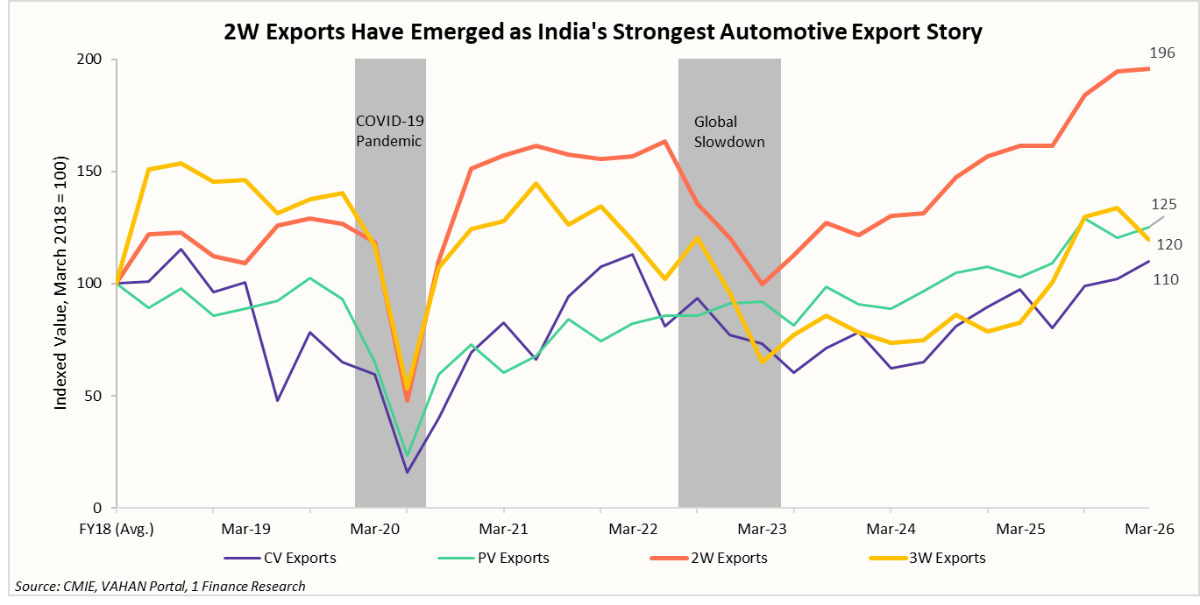
The export recovery was interrupted around Mar-23 as high global inflation, synchronised monetary tightening, slowing trade and foreign-exchange shortages across several emerging economies weighed on vehicle imports. The correction was most severe in CVs and 3Ws, reflecting their greater dependence on freight activity, infrastructure investment and public transport spending.
Since FY24, 2Ws have steadily widened their lead over every other segment, emerging as the main engine of India's automotive exports. While PVs, 3Ws and CVs have all recovered from the Mar-23 slowdown, their gains have been far more measured, leaving the export hierarchy increasingly tilted towards 2Ws.
Taken together, the charts underscore an important structural transition. India's automobile industry is supported by two distinct growth pillars, PVs driving domestic consumption and 2Ws powering export growth.
Despite exports remaining susceptible to global trade cycles, 2Ws have consistently retained their leadership, whereas strong domestic demand has provided a stable growth anchor for PVs, making the industry's growth profile more balanced than in previous cycles.
Beyond conventional automobiles, another structural transformation is underway. The next section explores the growth and evolving dynamics of India's electric vehicle (EV) market.
India's EV Transition Is Entering Its Next Phase
Electric vehicles (EVs) are steadily moving from a niche segment to an integral part of India's automobile industry. Overall EV penetration in India has increased from 2.3% in FY22 to 8.3% in FY26, reflecting a broad-based rise in adoption across vehicle categories.
Yet, despite this progress, India remains in the early stages of electrification. Passenger vehicle EV penetration stands at just 4.3%, well below China, where new energy vehicles now account for more than half of all new PV sales.
For an economy dependent on imports for over 85% of its crude oil needs, the transition to electric vehicles extends beyond environmental goals. It is a strategic response to reduce energy import dependence and strengthen resilience against recurring geopolitical disruptions along critical oil transit routes, such as the Strait of Hormuz.
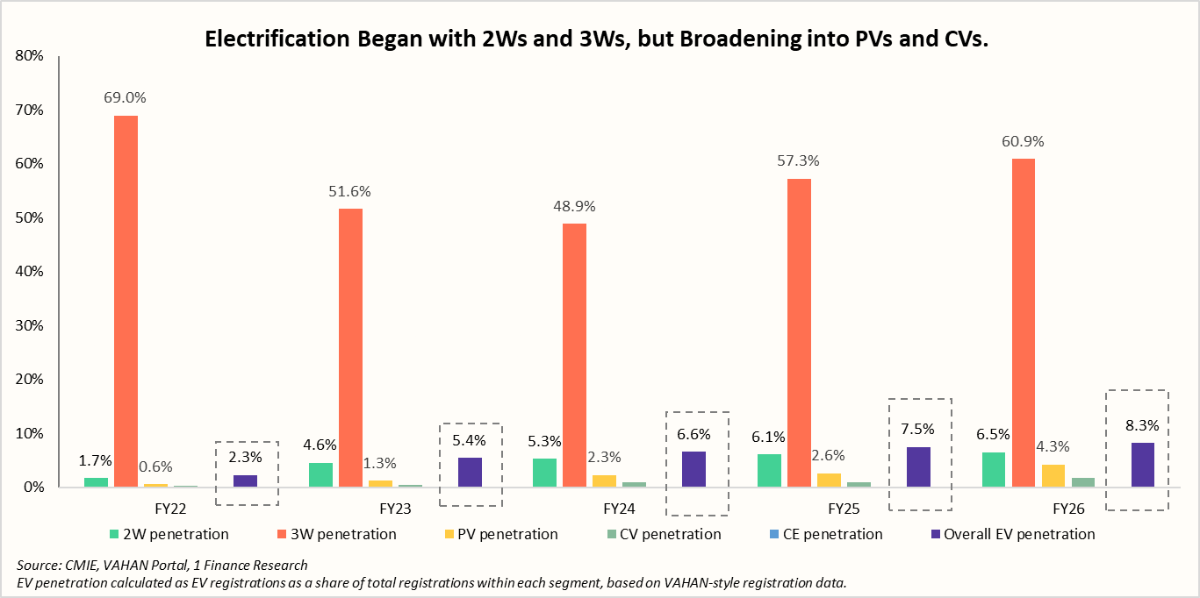
The transition towards EV’s has so far been led by 3Ws and 2Ws, where favourable operating economics, lower battery costs and government incentives have made electrification commercially viable. By FY26, EV penetration has reached 60.9% in 3Ws, dominated by passenger e-rickshaws, while 2Ws penetration increased from 1.7% in FY22 to 6.5%, contributing significantly to the rise in overall EV penetration.
The slower pace of adoption in PVs and CVs is mainly due to higher upfront costs, charging infrastructure constraints and a more gradual replacement cycle. While 2Ws and 3Ws continue to account for the majority of EV volumes, FY26 has witnessed strong growth in higher-value segments.
Electric PV sales have risen 84% YoY, while electric CV sales more than doubled (122% YoY), albeit from a relatively small base. This broadening of adoption beyond entry-level mobility marks an important shift in the industry's evolution.
The next phase of India's EV transition will therefore be defined less by incremental gains in 3Ws, where penetration is already well established, and more by the pace of adoption in 2Ws, PVs and CVs. Progress in these segments will also have a much larger impact on oil consumption, emissions and the domestic automotive value chain, making them the key determinants of India's long-term electrification journey.
Automobile Sector Outlook for FY27
The automobile sector enters FY27 from a position of strength as NIFTY Auto gained 11.6% in FY26, outperforming the NIFTY-50's 5.0% return, reflecting improving demand, supportive policy measures and easing financing conditions. However, the sector has historically been cyclical, with periods of strong outperformance often followed by a moderation as earnings growth and investor expectations normalise.
The long-term structural drivers remain intact. Increasing Premiumisation in PVs, steadily rising 2W exports, increasing EV penetration, rising household disposable incomes, and greater localisation should support both vehicle manufacturers and auto component companies. At the same time, the transition towards electronics-rich and EVs is expanding opportunities across India's automotive value chain, for component manufacturers supplying higher-value systems.
The near-term macro backdrop, however, is becoming less supportive than it was in FY26. Rising inflation, volatile crude oil prices and expectations of a below-normal monsoon could impact consumer sentiment, rural demand and vehicle affordability. While lower interest rates and continued infrastructure spending should provide support to PVs and CVs, a softer global trade environment may moderate export growth for 2Ws and auto components.
Overall, FY27 is likely to mark a phase of normalisation rather than broad-based acceleration like FY26. Domestic demand should remain strong, although growth is expected to slow across vehicle segments. Against a more uncertain global backdrop, export growth may also moderate from FY26's strong pace. Nevertheless, India's favourable demographics, rising motorisation and expanding manufacturing ecosystem continue to provide a strong foundation for the sector's long-term growth.