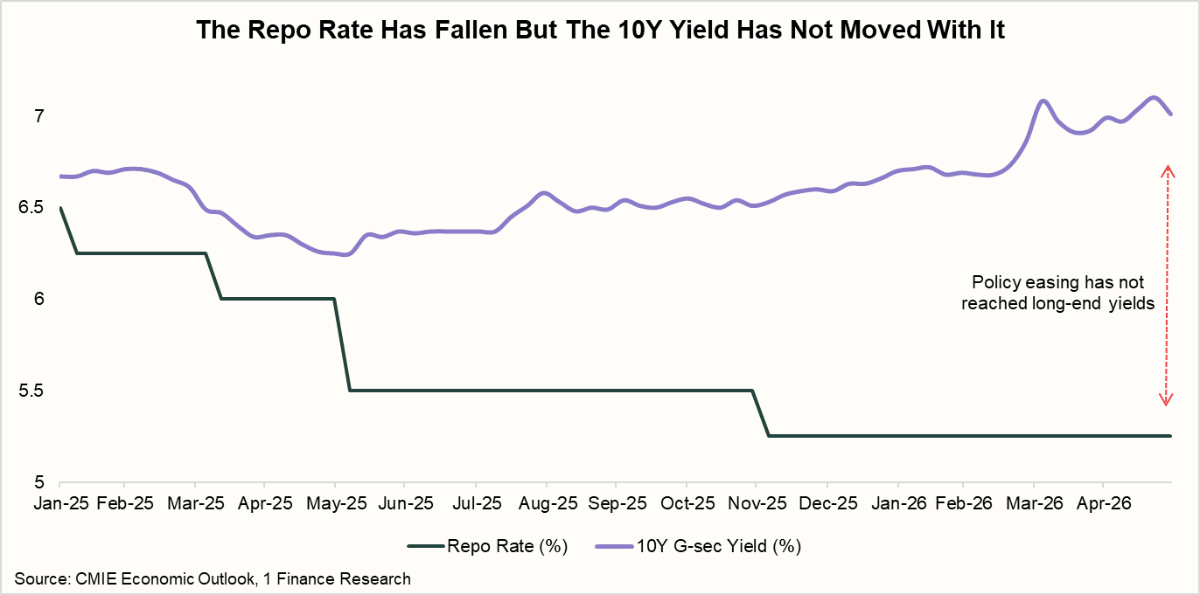
The RBI had cut the repo rate by 125 basis points since February 2025, from 6.50% to 5.25%. By the textbook, the 10-year government bond yield should have fallen 150 to 175 basis points. It has fallen barely 60 to 70, and the benchmark, at 6.53% in December 2025, has since climbed back toward 7% and held there through May even as the central bank stayed on hold.
That gap is the whole story of India's debt market in 2026. The easing cycle is over. A year ago, in our 2025 debt market review, the setup looked clean, with cooling inflation pointing to lower yields, but the easing has since happened while the relief at the long end has not. The question for the year ahead is no longer how much further the RBI cuts, but whether it holds or is forced to hike, and what an investor does with a bond portfolio once the rate tailwind has stopped blowing. The forces driving that are summarised below, and the sections that follow take each in turn.
Our 2026 Debt Market Outlook at a Glance
| Key Factor | Current Scenario (mid-2026) | Yield Curve Impact |
|---|---|---|
| Monetary policy | Repo held at 5.25%, easing cycle over, pause the base case | ↔ Short-end |
| Inflation and oil | RBI projects FY27 CPI near 4.6%, hike risk if it crosses 5 to 6% | ↑ Long-end |
| India-US spread | US 10-year near 4.5%, spread thin at 220 to 250 bps before hedging | ↑ Long-end |
| Foreign flows | Record equity outflows past ₹2.2 lakh crore in 2026, debt flows marginal | ↑ Long-end |
| Rupee and liquidity | FX reserves down about $47 billion since February, OMO paused since March | ↑ Long-end |
Note: ↑ pressures yield higher, → broadly neutral, ↓ pulls yield lower.
The net picture is a curve that stays steep, a long end that stays sticky near 7%, and a front end that has already absorbed the good news from the easing cycle. The base case for 2026 is range-bound yields with an upward bias at the long end, not the broad rally a 125 basis point cutting cycle would normally produce.
The Rate Cuts Have Run Their Course
This is not a transmission failure in the usual sense. The front end of the curve has responded to the RBI exactly as expected. What has happened is that two gravitational forces are working against each other. The easing cycle pulled yields lower. But a cluster of pressures—thin India-US spreads, foreign outflows, rupee weakness, and heavy bond supply—pulled harder the other way, and through the first half of 2026, they won. With the repo rate at 5.25% and the case for further cuts fading, the downward pull from policy is now spent.
The 10-year benchmark traded near 6.66% on February 27, just before the US-Iran conflict erupted, and has since risen roughly 45 basis points to hover near 7.10% before easing back toward 7% amid a softer oil tape in early June. Through this entire move, the repo rate did not change. A bond market that rises while the policy rate is flat is telling you that something other than monetary policy is now setting the price of long-dated paper.
Four pressures explain the gap, and each one matters more for the 2026 outlook than the next 25 basis points of any move the RBI might make. A thin India-US yield spread, a record exodus of foreign capital, a rupee that forces the RBI to drain liquidity, and a record supply of government paper.
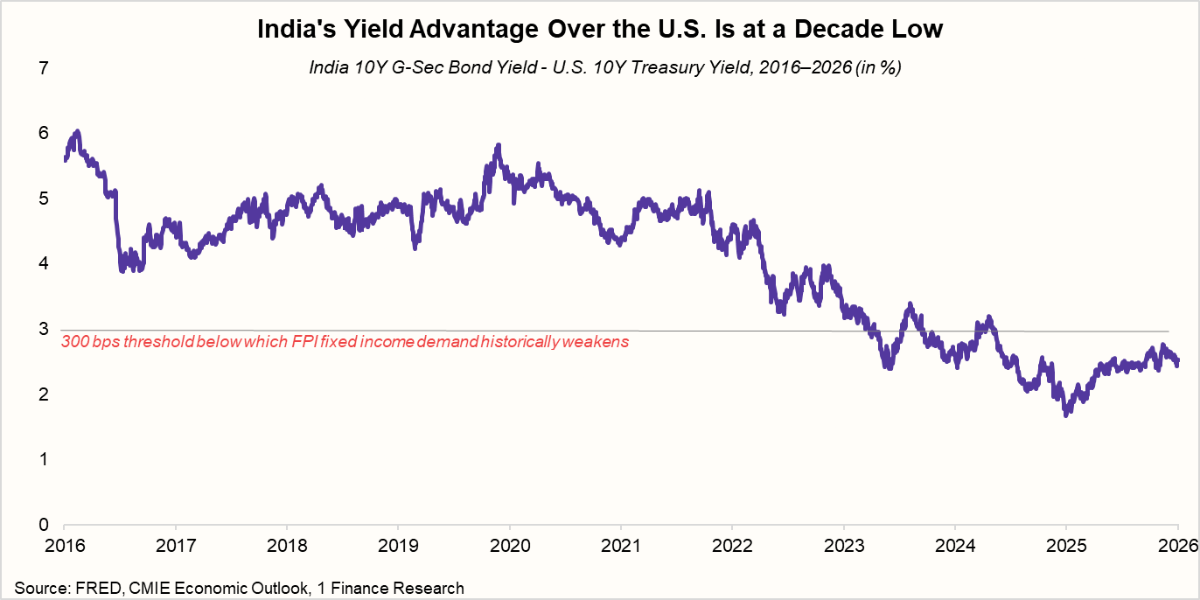
The India-US Yield Spread Has Become a Floor Under Indian Bonds
The first pressure is global, and it is the one that Indian policy cannot touch. With the US 10-year Treasury yielding around 4.5%, Indian G-Secs have to offer a spread wide enough to compensate a foreign investor for rupee risk and credit risk. Historically, that spread has needed to sit above roughly 250 to 300 basis points to generate meaningful foreign demand for Indian debt. It currently sits closer to 220 to 250 basis points.
The detail that matters is why it sits there. A year ago, in April 2025, the spread had compressed below 200 basis points, a multi-decade low, with the US 10-year near 4.49% and India's near 6.44%. It has widened modestly since, but for an unhelpful reason. The pickup improved because Indian yields rose back toward 7%, not because India became a safer or more attractive carry. And once a dollar investor pays to hedge the rupee forward, a cost that has run in the region of 2% and more, the net carry left over is thin to negligible. A spread that looks acceptable on a screen does not clear the bar once currency risk is priced in.
This is the dynamic behind our view that the global rate cut cycle is over. Developed-market long yields stay elevated even as central banks ease, because debt loads are high and term premiums are rebuilding. When the spread is this thin, foreign demand for Indian debt thins with it, removing a buyer that would otherwise help yields fall.
Foreign Investors Have Been Heading for the Exit
A thin spread does more than keep yields from falling. It removes a buyer, and in 2026, foreign investors have been doing the opposite. Net FPI equity outflows crossed ₹2.2 lakh crore by mid-May, the heaviest calendar-year exit since 1993, with a record single-month ₹1.17 lakh crore leaving in March alone. April added another ₹60,847 crore. FPIs have been net sellers in every month of 2026 except February. Foreign ownership of Indian equities has fallen to about 14.7%, a 14-year low, slipping below domestic ownership for the first time.
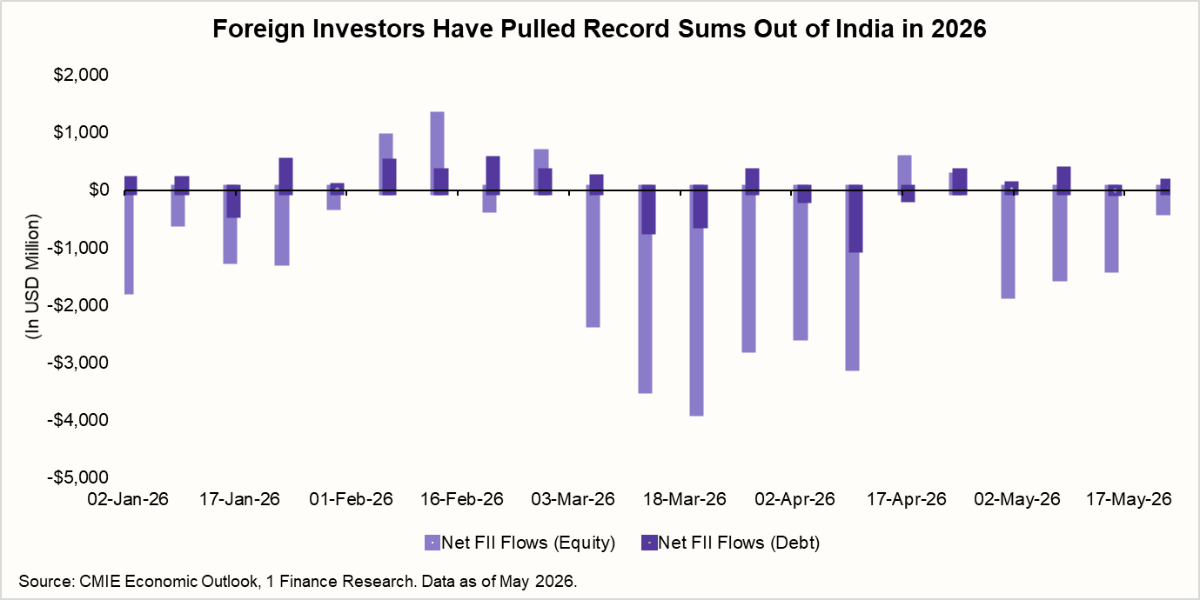
The selling is concentrated in equities, but it reaches the bond market through the currency. Foreign demand for Indian debt has stayed marginal, well below permitted limits, because the hedged carry no longer justifies the risk. So the bond market loses a buyer just as the equity exodus and weak debt inflows create steady dollar demand that weighs on the rupee. Domestic institutions have cushioned share prices but cannot offset the currency effect that feeds back into yields.
The drivers, the West Asia conflict and the crude it carries, a strong dollar, elevated US yields, a rupee in the 92 to 95 band, and stretched valuations, are mostly unresolved. Until some reversal, the marginal foreign rupee is leaving rather than arriving.
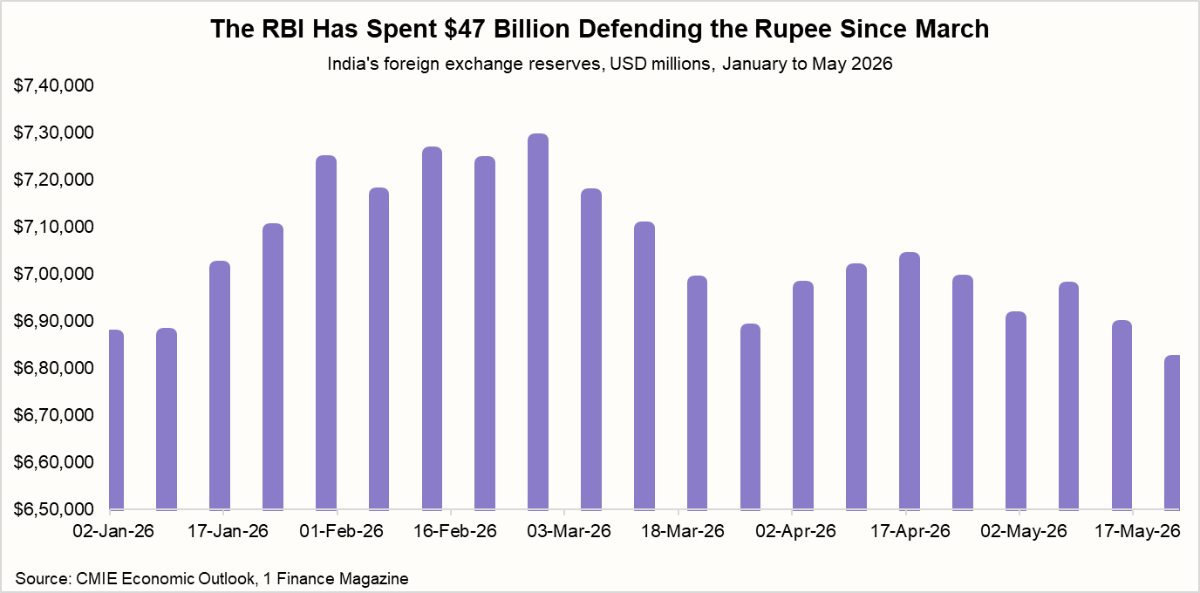
The Rupee Forces the RBI to Drain the Liquidity Bonds Need
That dollar demand lands on the rupee, and the rupee's effect on yields is indirect but powerful. To slow the slide, the RBI has intervened in the foreign exchange market. Reserves have fallen by close to $47 billion since the conflict began on February 27, leaving the stock near $680 billion. Every dollar the central bank sells pulls rupee liquidity out of the banking system. Banks running tighter liquidity become more reluctant buyers of government bonds, and that reluctance keeps yields elevated even while the central bank is officially in easing mode.
For most of FY26, the RBI offset this drain with aggressive open market operations, buying a record ₹6.45 lakh crore of bonds, more than double the FY25 figure. This was about keeping banks flush with cash, not about forcing bond yields lower.
But since March, the RBI has stopped making fresh OMO purchases. This matters because the government is selling record amounts of bonds right now. Without the RBI as a buyer, banks must absorb the entire supply, but they have less money to do so because the RBI's intervention to support the rupee has drained liquidity from their balance sheets.
If the rupee stays under pressure and the RBI continues to sell dollars to defend it, banks will keep facing this liquidity squeeze. That becomes a recurring problem for bonds through 2026: more supply hitting the market, fewer buyers with cash to absorb it, and yields pushed higher as a result.
The Yield Curve Is Steepening and the Message Is Hard to Miss
Put these pressures together, and the curve does exactly what you would expect. The front end has fallen in line with repo cuts, with the 2-year G-Sec near 5.6 to 5.8%. The long end has not followed, with the 10-year near 7%. That leaves the 10-year over 2-year spread around 120 to 140 basis points, its widest in several years.
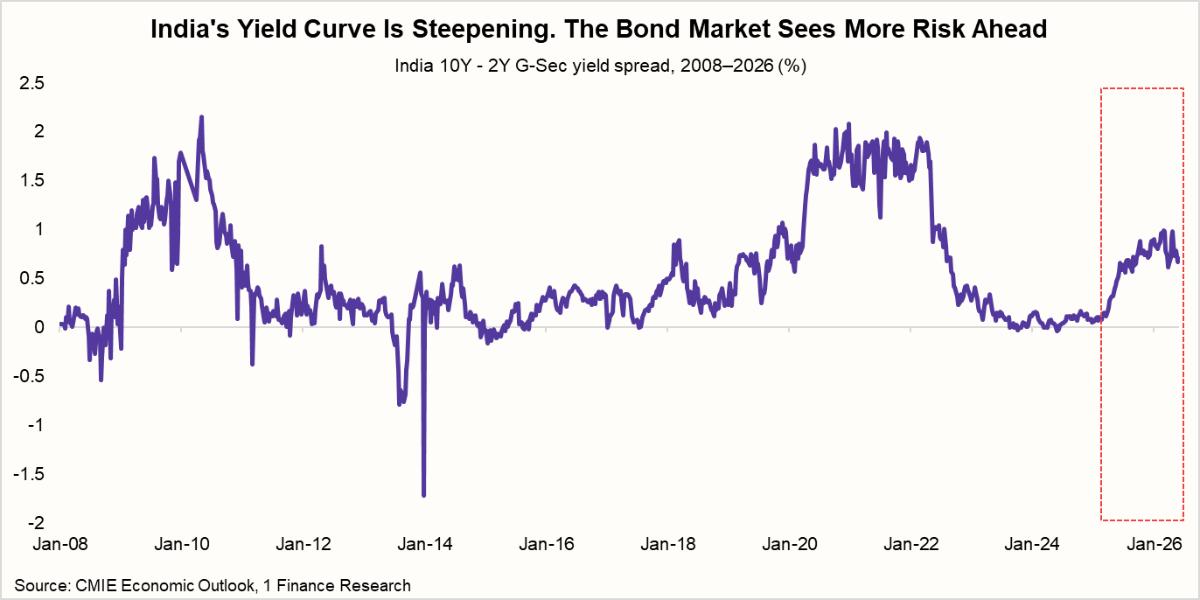
A steep curve like this carries a clear message. The market has fully priced the RBI's rate cuts at the front end, where monetary policy has direct control. At the long end, investors are demanding more compensation for duration, supply, and global pressure than the easing cycle can supply on its own. Forecasts from several market participants point to the 10-year staying elevated, with estimates clustering around 7.3% by mid-2026 and as high as 7.5% by September if borrowing pressure and inflation risk persist.
A Pause Is the Base Case, and a Hike Is the Live Risk
With the repo rate at 5.25% and the long end refusing to fall, the more useful question is what the RBI does from here. Our base case for 2026 is a prolonged pause. The central bank projects FY27 GDP growth at 6.9% and inflation at 4.6%, a combination that does not demand further support for growth and leaves limited room to ease, with price risks tilted upward. After 125 basis points of cuts, the easing cycle has done its work, and the bar for additional cuts is high.
The risk that matters is on the other side. India's inflation tolerance band runs from 2% to 6% around a 4% target. As long as CPI holds in the 4 to 5% zone, a pause is comfortable. If inflation pushes above 5% and starts heading toward the 6% ceiling, most plausibly through a renewed oil shock feeding into a weak rupee, the RBI's reaction function shifts from holding to hiking.
| Scenario | Trigger | Our probability through 2026 | Bond market impact |
|---|---|---|---|
| Extended pause | CPI holds in the 4 to 5% range, oil contained | High | Yields range-bound, long end sticky near 7% |
| Rate hike | CPI sustains above 5% toward 6%, oil and rupee shock | Medium | Long end repriced higher, curve flattens from the front |
| Resumed cutting | Oil falls sharply, growth weakens, inflation undershoots | Low | Long end finally rallies, duration rewarded |
We assign that scenario a meaningful but not dominant probability, and it is the single development that would push the long end decisively higher from current levels.
How Debt Funds Behave When the Easing Cycle Ends
Debt funds make money in two ways. The first is the interest they earn on the bonds they hold, which is steady and predictable. The second is a price gain that appears only when interest rates fall, because bonds issued earlier at higher rates become more valuable. In an easing cycle, both work together. Once the rate cuts stop, the price gain fades, and if rates rise again, it turns into a loss.
A pause is not bad for debt funds. It is often their best phase. During the last pause, when the RBI held rates steady from February 2023 to February 2025, returns were the strongest in years: liquid funds earned around 7%, short-duration funds around 8%, and dynamic bond funds around 9%. Rates were high, so the interest was good and steady, so there were no price losses to cancel it out. By comparison, the 2022 to 2023 hike cycle dragged the same funds down to 4 to 5%, and the low-rate years of 2020 to 2022 left liquid funds at just 3%.
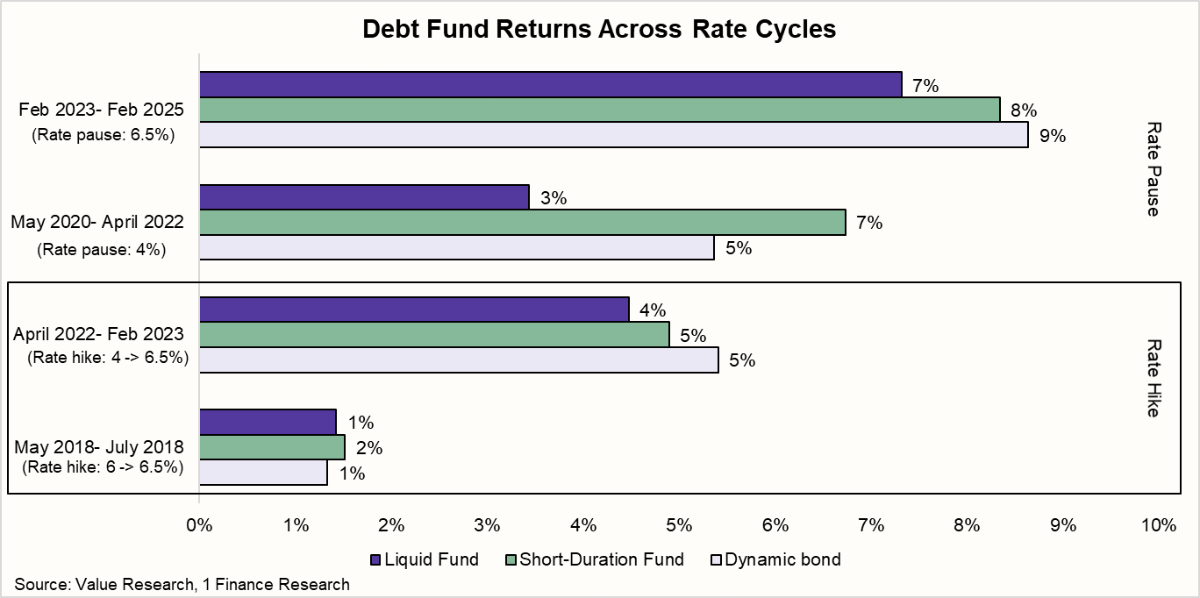
For 2026, this is encouraging because another pause is the setup that rewards these funds. The one risk is a hike if inflation climbs past 5 to 6%. Short-duration and liquid funds held up even through the last hike, so they make the safer core, while dynamic bond funds only pay off if cuts return. The smart move is to lock in today's high yields rather than wait for a rally that may not come.
Tax Has Quietly Changed the Math on Debt Funds
Yields are only half the story. What an investor keeps depends on tax, and the rules changed sharply in April 2023. Gains on debt funds are now taxed at the investor's income slab rate, no matter how long the units are held, with no long-term relief. For someone in the top bracket, a 7.5% return shrinks to about 5.2%. That has pushed advisors toward two more tax-friendly homes for conservative money, arbitrage funds and the newer Income Plus Arbitrage fund of funds. The table compares all three.
| For a top-bracket investor | Regular debt fund | Arbitrage fund | Income Plus Arbitrage FOF |
|---|---|---|---|
| How it earns | Bond interest plus duration | Hedged cash-futures spread | Mostly bond interest, small arbitrage sleeve |
| Typical gross return | ~7- 8% | ~6.5- 7.5% | ~6.5- 8% |
| Short-term tax | Slab rate | 20% under 12 months | Slab rate under 24 months |
| Long-term tax | Slab rate, no relief | 12.5% over 12 months | 12.5% over 24 months |
| Post-tax if held long term | ~5.2% | ~6.1% | ~6% |
| Interest-rate risk | Low to moderate | Negligible, hedged | Low |
| Best suited to | Low brackets, short horizons | High brackets, 1 year plus | High brackets, 2 years plus |
Note: Illustrative, for a 30% bracket investor, excluding surcharge and cess nuances.
Debt funds are not obsolete. For lower tax brackets, or money needed within a year, they stay simple and efficient. But for a high-bracket investor holding for a year or more, the post-tax gap is wide enough to matter, which is why so much conservative money moved toward arbitrage and arbitrage-linked structures through 2025 and 2026. The pull is the same one running through this outlook, since high and steady rates lift the returns on all three while the RBI holds.
What We Are Watching Through 2026
A few specific catalysts will decide whether the long end finally rallies or grinds higher from here. The RBI MPC decision is the immediate marker, with a hold extending the current standoff and any hint of a hike pushing the long end higher quickly.
We watch the India-US 10-year spread closely, with a compression below 200 basis points, the level that historically signals foreign demand drying up, alongside monthly FPI flows and foreign ownership, which are the clearest live read on whether the capital exodus is slowing. Brent crude remains the key external trigger, since a renewed move higher feeds straight into the inflation path and tips the balance toward a hike, and a sustained move below $90 with a stable rupee would be the first sign that foreign flows can turn.
The practical point for a debt investor is that two of the three scenarios, carrying the bulk of the probability, are unfriendly to long duration. That asymmetry is the core of the 2026 outlook.
For a real-time read on where the rate cycle is heading, our Interest Rate Outlook Index tracks the repo trajectory and policy stance, and the 1 Finance Macroeconomic Index places the current phase in the broader growth cycle.