Going into 2026, the forecasts were almost cheerful. After a soft 2025, analysts expected Asia's weaker currencies, the rupee among them, to recover as the dollar eased. Instead, the rupee hit an all-time low of 96.84 in May, the Indonesian rupiah fell below its 1998 crisis level, and the Korean won sank to a 17-year low.
This edition explains what happened in three steps. Where Asia's currencies stood in 2025, what broke in 2026 and why it hit so hard, and where things go from here. India sits at the centre of the story because it turned out to be one of the most exposed economies in the region.
Asian Currencies Outlook in 2026
| Currency | Direction | What decides it next | Our call for 2026 |
|---|---|---|---|
| Indian Rupee | ▲ Weaker | Oil and whether Hormuz reopens, then foreign flows | 95-100; real relief only if the Strait clears |
| Japanese Yen | ▲ Weaker | Bank of Japan rate hikes against the Fed | Weak, 158-165 until the gap narrows |
| Korean Won | ▲ Weaker | Pace of capital outflows | 1,480-1,580; a turn needs flows to reverse |
| Indonesian Rupiah | ▲ Weaker | Confidence in the central bank and budget | 17,500-19000; More downside risk |
| Chinese Yuan | ▼Firmer | US-China talks and safe-haven demand | Firm, range-bound near 6.8 to 7.5 |
How the Recovery Reversed
2025 was not a bad year for most of Asia. The US dollar was broadly weak, which is normally a tailwind for the region, and the picture was mixed rather than alarming. The Chinese yuan and the Korean won both gained against the dollar over the year, and the Japanese yen held roughly steady, supported by bets that the Bank of Japan would keep raising rates.
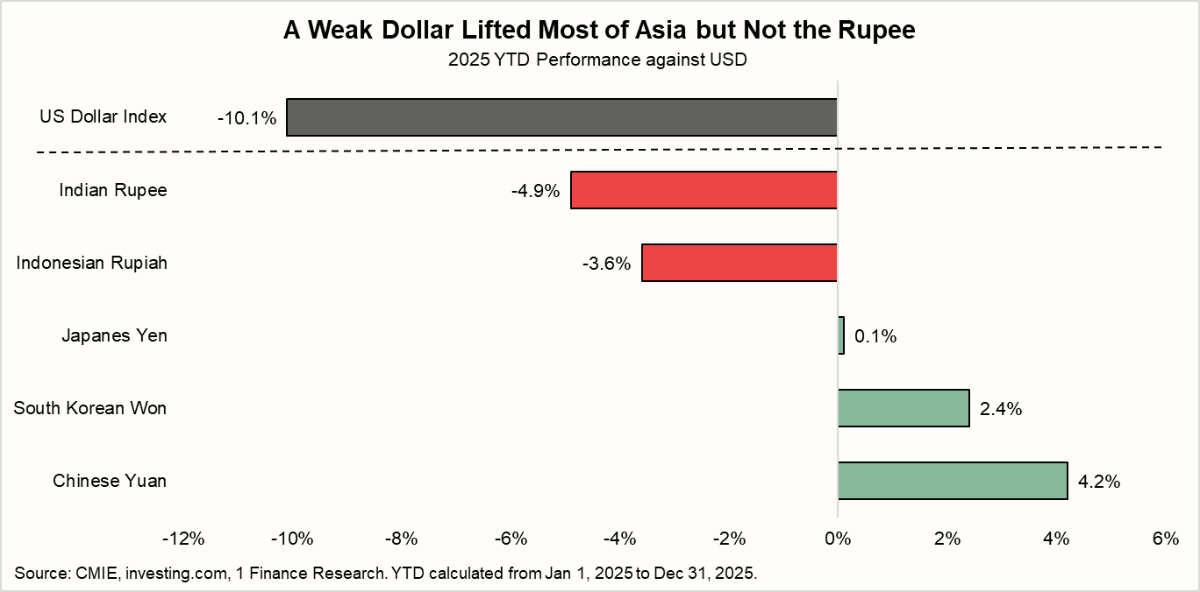
The weak link was the high-yielders, and the rupee was the weakest of all. Despite the helpful dollar backdrop, the rupee was Asia's worst-performing currency in 2025, down about 4.9%, and it ended the year drifting toward 89 to the dollar. The cause was not the trade account, which was in reasonable shape. It was money leaving the country. Foreign investors pulled a record 1.66 lakh crore rupees, close to 19 billion dollars, out of Indian equities in 2025, the largest annual exodus on record.
So India entered 2026 on the back foot, the soft spot in the region, and still the consensus expected a bounce. Then the trigger arrived. On 28 February, US and Israeli strikes on Iran left the Strait of Hormuz effectively closed from early March. The Strait is the narrow waterway through which roughly a fifth of the world's oil passes. Behind a US naval blockade, Brent crude averaged 118 dollars in April, its highest since 2008, before easing toward 94 dollars by June as ceasefire talks flickered.
| Currency | Country | June 2026 Level (vs USD) | YTD 2026 Performance (%) | What drove the move |
|---|---|---|---|---|
| Rupee | India | ~95-96 | -6.3% (rebounded from -10% low) | An oil shock hit its biggest weakness: 85% crude imports, half via Hormuz |
| Rupiah | Indonesia | ~17,000-18,000 | -8.1% | Fiscal and credibility fears, plus oil |
| Won | South Korea | ~1,490-1,560 | -5.4% | Capital fleeing into US assets; sensitive to China demand & global tech cycle |
| Yen | Japan | ~160 | -2.2% | Rate gap with the Fed and a reflationary government |
| Yuan | China | ~6.7-6.8 | +3.2% | Became the region's safe haven; capital flight to China, managed peg, no oil import panic |
An oil shock of that size does not hit every economy the same way, and the table has no single story. The rupee and rupiah were hit most directly through the oil bill. The yen and won were already weak on Japan's rate gap and Korea's capital outflows, with oil only adding to the strain. None had the buffers, home production, vast reserves and a trade surplus that kept the yuan firm and made it the region's refuge as the dollar and yen sagged.
The oil shock did not act alone. It landed on a region already softened by slower forces, which is why these currencies were soft before the Strait ever closed. Capital had been draining out of Asia and into the US AI boom. The wide gap between high US interest rates and low Asian ones kept money flowing toward the dollar. And US tariff threats had unsettled every export economy. The oil shock was the acute trigger. These were the underlying chronic conditions.
Recommended for you
Readers also explored

Currency in Circulation: How Much Money Exists in the World?

India’s Unemployment Rate in 2025
Why India Was So Exposed
On paper, India looks insulated. It walked away from Iranian crude in 2020 and now buys heavily from Russia, a supplier no Gulf crisis can touch. But the risk was never who sells India its oil. It is the single waterway most of it travels through. About 2.1 million barrels a day, a little under half of India's crude imports, still come through the Strait of Hormuz, along with much of its gas, so when the Strait closes, India feels it regardless of where the oil is bought.
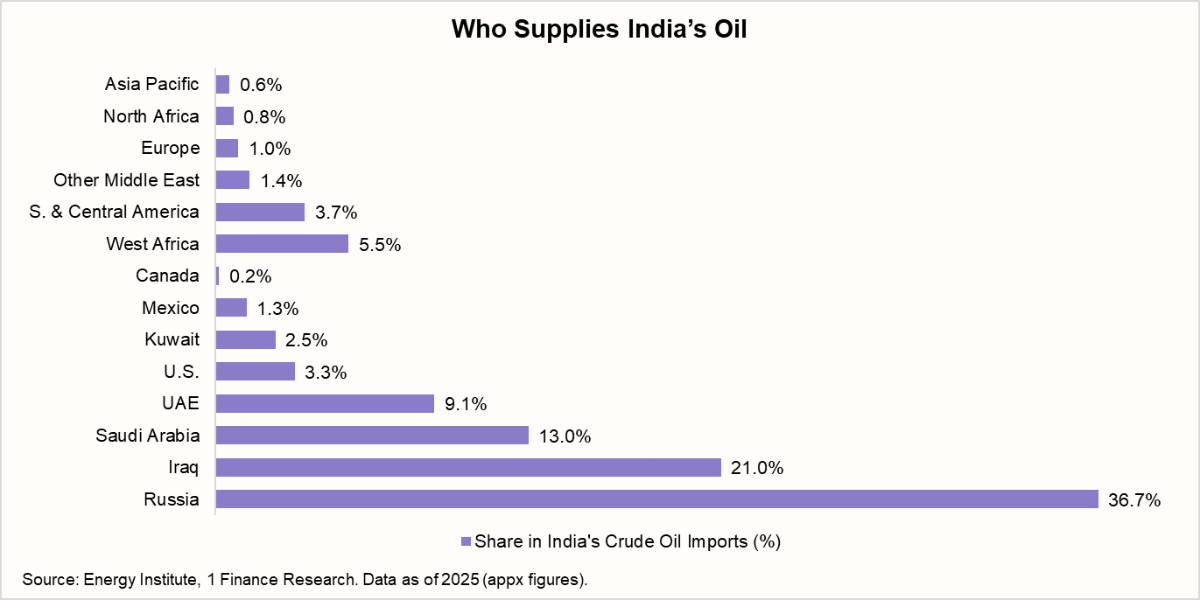
| 💡India imports more than 85% of its crude, and about 2.1 million barrels a day of it, a little under half, comes through the Strait of Hormuz. The exposure is the chokepoint, not the supplier. |
Because India imports so much of its energy, the path from a higher oil price to a weaker rupee is direct and measurable.
Every 10-dollar rise in crude adds an estimated 13 to 16 billion dollars to the annual import bill, widens the current account deficit, the gap between what India pays the world and what it earns, and pushes up inflation. The table shows what this year's oil move actually cost.
| Brent average | Extra annual oil import bill | CAD impact | Inflation impact (CPI) |
|---|---|---|---|
| 70 (pre-shock) | base | base | base |
| 95 (now) | 33-40 billion dollars | +75-100 bps | +50-75 bps |
| 118 (April peak) | 60-75 billion dollars | +140-190 bps | +95-140 bps |
| 120 plus (stress) | 65-80 billion dollars | +150-200 bps | +100-150 bps |
April's $118/barrel oil was not a small tax. It widened India's external deficit by an estimated 140 to 190 basis points of GDP, the kind of strain that pushes a currency to a record low. One relief is that the government usually absorbs part of the shock through taxes and subsidies, which softens the inflation hit but shifts the cost onto its own budget instead.
But the sharper point is where the real pressure came from. India's trade gap widening is only half the story. The other half is money fleeing. As oil spiked and risk appetite soured, foreign investors accelerated an exit that was already underway.
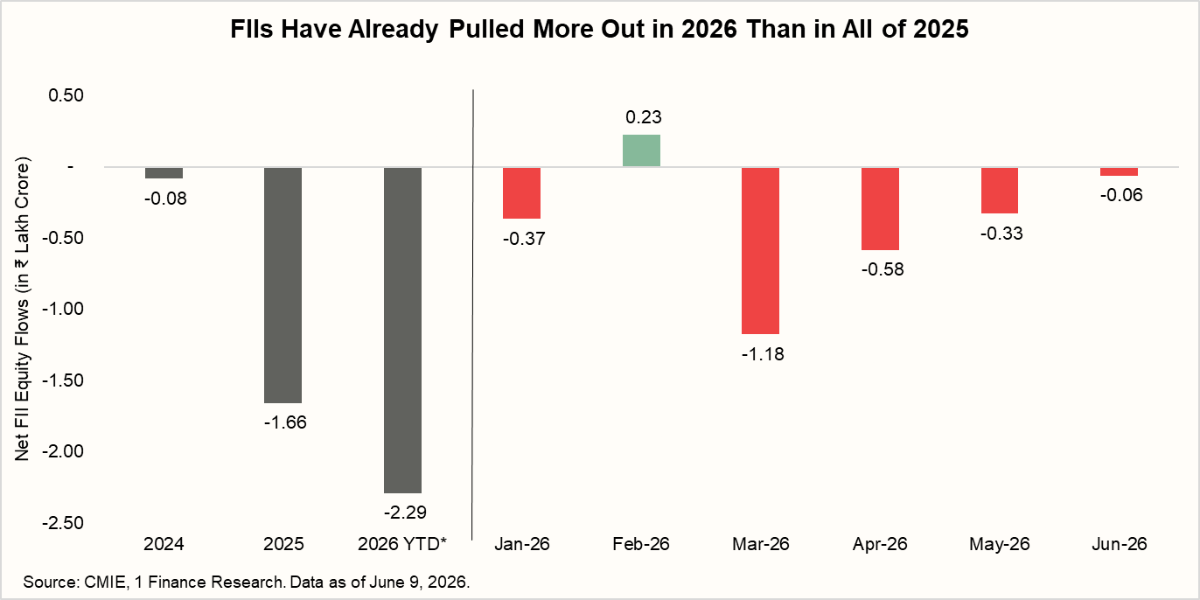
Foreign investors have withdrawn about 2.29 lakh crore rupees from Indian equities in 2026 so far, already more than the 1.66 lakh crore they pulled in all of 2025. March alone saw a net outflow of over $ 10 billion, the steepest in months, and selling continued into June. This is the real engine of the rupee's slide. India's current account deficit is actually modest, near 1% of GDP, held down by a strong services surplus and remittances. The problem is the capital account, where the oil shock turned a steady drift of outflows into a flood.
Managing all this has a cost. The RBI has been selling dollars to slow the fall, and its reserves eased to about 682 billion dollars by end-May 2026 from around 728 billion earlier in the year. That is still a very comfortable buffer, covering roughly 11 months of imports, which is exactly why the slide has been orderly rather than chaotic.
Why the Rupee Is Repricing, Not Breaking Like 1997
For anyone who lived through the Asian financial crisis, a record-low currency rings an alarm. For India specifically, the comparison does not hold, and the difference changes how an investor should respond. India was not actually at the centre of 1997. The currencies that broke then were Thailand's, Indonesia's and Korea's, whose fixed pegs snapped under heavy short-term dollar debt. India, already on a managed float since the early 1990s and shielded by a relatively closed capital account, came through with only a mild depreciation.
The useful comparison is therefore India then versus India now, and on every measure that decides whether a shock becomes a crisis, India is better defended today.
| Feature | India in 1997 | India in 2026 |
|---|---|---|
| What triggered it | Spillover from the regional crisis | An external oil and geopolitical shock |
| Exchange-rate system | Managed float, recently adopted | Managed floats that drift gradually |
| Foreign debt | Low external debt, little short-term dollar exposure | External debt about 19% of GDP, mostly rupee-denominated and long-term |
| Reserves | Roughly $30B | $682B (May 2026) |
| Policy response | Limited room, cautious defence | Central banks are smoothing the move (RBI selling dollars) |
In 1997, the currencies broke because the pegs holding them broke, and economies with large dollar debts could not pay as their currencies collapsed. In 2026, the trigger is external, an oil shock, not a flaw in the financial plumbing. Currencies float and adjust rather than snapping, debts are mostly in local currency, and reserves are deep. Even the rupiah, the closest thing to a 1997 echo, is falling on a loss of confidence in government policy, not a debt spiral. For the rupee, this is a repricing forced by oil, not a crisis.
What Past Oil Shocks Tell Us
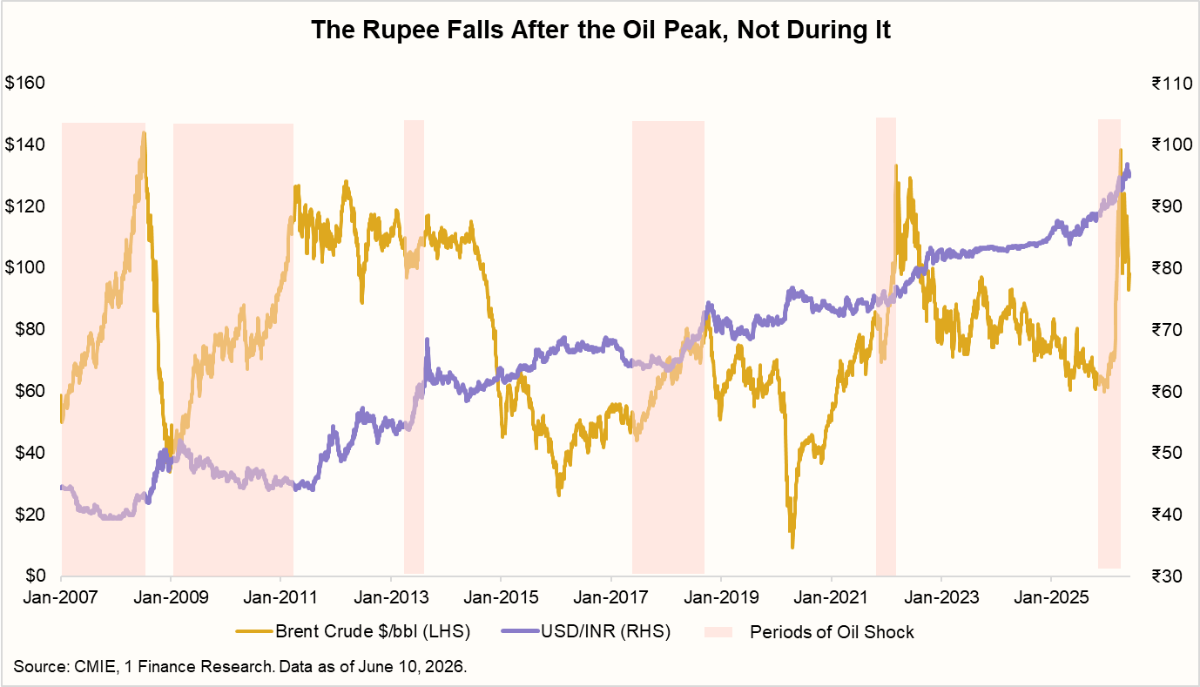
Every major oil spike since 2007 has weakened the rupee, and almost all have been Middle East supply shocks India could not avoid. The surprise is the timing.
| Oil shock | Why oil moved | Brent rise | Rupee's full fall | Time to its low |
|---|---|---|---|---|
| 2008 Demand Supercycle | China and India demand boom | +147% | −13% | 8 months after |
| 2011 Arab Spring Shock | Libya war cut the supply | +65% | −12% | 8 months after |
| 2013 Taper Tantrum | Fed taper, capital flight | +9% | −15% | with the peak |
| 2018 Iran Sanctions Spike | US exits the Iran deal | +75% | −13% | with the peak |
| 2022 Ukraine War Shock | Russia invades Ukraine | +58% | −9% | 9 months after |
| 2026 Hormuz Closure | Strikes on Iran, Strait shut | +76% | −5% so far | 1 month in |
In most episodes, the rupee held while crude climbed, then slid to its low months after oil had peaked, by eight months in 2008 and 2011, and nine in 2022. The reason is mechanical. An oil price jumps the day a route is threatened, but the cost lands only as that crude is bought, shipped and paid for, and foreign investors sell only once the wider deficit and inflation show up in the data. A capital-flight shock moves the rupee the same day, which is why 2013, the taper tantrum, fell in step with oil.
The completed shocks show the rupee growing more resilient, with the 2022 spike far bigger than 2013 yet the drawdown smaller, about 9% against 15%. The 2026 fall is milder still at about 5% but only so far, since the adjustment takes months and the Strait is still shut. Deeper reserves, a managed float, and a crude mix now tilted toward Russian barrels outside the Strait have blunted each blow. This year's record low is a record in level, not severity.
The warning sits in the same data. The adjustment takes months, and 2026 is one month old with the Strait still shut. The move to 96.84 may not be the end.
The Outlook From Here
One variable now matters more than any other. Whether the Strait of Hormuz reopens decides the near-term path for every oil importer, the rupee included.
Our base case for the rupee is more managed weakness, holding in a 95-100 range, with the RBI smoothing the move rather than fighting it.
The central bank also has a more durable tool (FCNR) than spending reserves. In June, it opened a special window to pull NRI dollars back into the country, with estimated inflows of 40 to 60 billion dollars by September against roughly 25 billion of equity outflows this year. That makes a floor easier to hold, but it buys time rather than removing the cause, since the window closes in September while the oil risk runs on.
The risk leans toward more depreciation while the Strait stays shut, and the fastest source of relief would be a credible reopening that brings oil down. It is worth remembering that the rupee is not expensive in real effective terms. The REER, which measures the rupee against its trading partners adjusted for inflation, had been running rich, so part of this weakness is a competitiveness reset that helps exporters rather than pure decline. The RBI's own 2026-27 outlook, growth near 6.9% and inflation at 4.6%, assumes the economy absorbs this rather than buckling under it.
For an Indian investor, the practical message is to stop treating each new record low as a shock and start treating a structurally softer rupee as the base case.
- The clearest beneficiary has been gold. It has risen on both the global safe-haven rush and the falling rupee, which is a double engine for an Indian holder, since a weaker rupee lifts the local price even when the dollar price stalls.
- Beyond gold, a weaker rupee helps companies that earn in dollars, which favours quality IT services and pharma, where overseas revenue converts into stronger rupee earnings. It hurts heavy energy importers and airlines, where fuel is a large share of costs, so the oil call and the currency call have to be made together.
- And holding some assets abroad, unhedged, is now a useful diversifier rather than a luxury. What does not follow is selling good domestic businesses simply because the rupee is weak, since the exchange rate moves market sentiment far more than the companies underneath.
The one idea to carry forward is this. Asia's currencies have stopped moving as a group, with the yuan and the won at opposite ends of the same year. The old habit of treating the region as a single trade no longer works. The economies that import their energy, India among them, are the ones to watch, and the Strait of Hormuz is the switch that turns the whole thing on or off.
The rupee is not breaking. It is repricing under an oil shock, in a region that has stopped moving together, and the investors who understand that difference will waste less energy on headlines and more on the regime that is already here.