Over the last five years, almost every major asset class has had its moment in the sun. Gold quietly outperformed equities. Developed Markets matched Indian equity returns despite one of the sharpest global tightening cycles in decades. Emerging Markets went from laggards to leaders almost overnight. And even within Indian equities, leadership shifted sharply amongst large, mid, and small-cap segments.
That is the problem with linear investing narratives: markets rarely move in straight lines, but investors often extrapolate recent winners as permanent trends. The reality is far more cyclical.
This edition explores how different asset classes performed across one of the most volatile macroeconomic periods in recent history, and why diversification, patience, and understanding the economic cycle matter far more than chasing the best-performing asset of the moment.
| Key Takeaways |
| Silver and Gold have delivered the strongest 5-year CAGR (+26%) among major asset classes, supported not just by geopolitics, but by structural central bank demand. |
| Developed Markets (+11%) matched Indian equity returns over 5 years, mainly driven by strong US tech earnings and steady INR depreciation. |
| Emerging Markets significantly outperformed Indian equities during 2025–26 as global capital rotated toward cheaper cyclical opportunities. |
| Indian equities have corrected considerably due to valuation compression, not weakening earnings. Mid-Caps remained the top performers, delivering a strong 17% growth (5-year CAGR). |
| REITs delivered a strong 12% 5-year CAGR, outperforming debt while providing diversification, rental income, and real estate exposure. |
| The current macro phase appears more transitory than structural, favouring balanced allocation over aggressive risk concentration. |
Comparing Asset Class Performance Across Cycles
Asset class leadership rarely stays constant for long. Different phases of the economic and market cycle tend to reward different segments of the market, whether equities, debt, gold, real estate, or global assets. That cyclicality is exactly what the asset performance matrix seeks to capture by assessing the shifting hierarchy of returns across major asset classes over time.
The quilt tracks the annual performance of key domestic and global asset categories, including large-, mid-, and small-cap equities, gold, fixed income, international equities, REITs/InvITs, and real estate-linked indicators. Rather than focusing on a single year or market event, it highlights how leadership rotates across cycles, often in ways investors least expect.
The chart below compares the annual performance across major asset classes.
| 2019 | 2020 | 2021 | 2022 | 2023 | 2024 | 2025 | 2026 (YTD) | Last 5Y CAGR |
|---|---|---|---|---|---|---|---|---|
| BTC 88% | BTC 361% | Smallcap 62% | Gold 13% | BTC 154% | BTC 140% | Silver 122% | EMs 27% | Silver 31% |
| DMs 28% | Silver 45% | Midcap 47% | REITs & InvITs 10% | Smallcap 48% | Midcap 26% | Gold 72% | Silver 22% | Gold 28% |
| REITs & InvITs 23% | Gold 30% | BTC 45% | Real Estate 10% | Midcap 44% | Smallcap 24% | EMs 37% | Gold 14% | MidCap 17% |
| Gold 22% | Smallcap 25% | Lgcap 25% | Silver 9% | DMs 22% | Silver 25% | DMs 25% | DMs 12% | SmallCap 15% |
| Silver 20% | Midcap 24% | DMs 22% | Debt 5% | Lg Cap 20% | DMs 21% | REITs & InvITs 25% | REITs & InvITs 2% | BTC 13% |
| EMs 18% | EMs 19% | Real Estate 8% | Cash 5% | Gold 15% | Gold 23% | Real Estate 11% | Real Estate 2% | REITs & InvITs 12% |
| Real Estate 12% | DMs 17% | REITs & InvITs 8% | Lg Cap 4% | Silver 11% | REITs & InvITs 16% | Lg Cap 9% | Cash 2% | DMs 11% |
| Lg Cap 10% | Lg Cap 15% | Debt 4% | Midcap 3% | Debt 8% | Real Estate 13% | Debt 8% | Debt 1% | Real Estate 10% |
| Debt 9% | Real Estate 11% | Cash 3% | Smallcap -4% | EMs 7% | Lg Cap 12% | Cash 6% | MidCap 1% | Lg Cap 9% |
| Cash 6% | Debt 9% | EMs -3% | DMs -10% | Real Estate 6% | Debt 8% | MidCap -6% | Smallcap 1% | EMs 8% |
| Midcap 0% | Cash 3% | Gold -3% | EMs -14% | Cash 5% | EMs 8% | BTC -2% | Lg Cap -8% | Debt 7% |
| Smallcap -8% | REITs & InvITs -7% | Silver -5% | BTC -61% | REITs & InvITs 0% | Cash 7% | SmallCap -6% | BTC -10% | Cash 6% |
Returns for Developed Markets and Emerging Markets converted in INR terms, based on the end-of-period exchange rateMarket Data considered as of May 22, 2026. Gold and Silver prices data are considered as of Apr 30, 2026. Real Estate Data is considered as of March 31, 2026.
| Abbrevation | Asset Class | Index |
| Lg Cap | Indian Large Cap Equities | Nifty-100 |
| Midcap | Indian Midcap Equities | Nifty Midcap 150 |
| SmallCap | Indian Smallcap Equities | Nifty Smallcap 250 |
| Real Estate | Indian Residential Real Estate | 1 Finance Housing TRI |
| REITs & InvITs | Indian REITs & InvITs | Nifty REITs & InvITs TRI |
| Gold | Gold | XAU/USD (INR terms) |
| Silver | Silver | XAG/USD (INR terms) |
| BTC | Bitcoin | Bitcoin (INR terms) |
| DMs | Developed Market Equities | MSCI World Index (INR terms) |
| EMs | Emerging Markets Equities | MSCI Emerging Markets Index |
| Debt | Debt | Aditya Birla SL Liquid Fund(G), ICICI Pru All Seasons Bond Fund(G) and ICICI Pru Short Term Fund(G). |
| Cash | Cash | Nifty 1D Rate Index |
Here is a breakdown of each asset class and the driver of their performance.
Gold
Traditionally viewed as a defensive hedge, Gold has outperformed every major asset class with a 26% 5-year CAGR. Since the Russia–Ukraine war, Gold is no longer just seen as a theoretical hedge. Central banks like the RBI and China have been steadily increasing gold allocations as a strategic reserve asset. Importantly, this reflects long-term sovereign reserve positioning rather than speculative demand.
The 2026 YTD return of 10% comes against a backdrop where the acute geopolitical premium from the Hormuz disruption has partially moderated, yet gold has held its level. That is structural demand absorbing what would otherwise have been a correction.
Developed Markets and Emerging Markets
Developed markets, tracked through the MSCI World Index, have quietly delivered returns on par with Indian equities over the last five years, compounding at 10.9% annually. Much of this strength came from the US, where corporate earnings held up remarkably well despite one of the sharpest global rate-hiking cycles in decades.
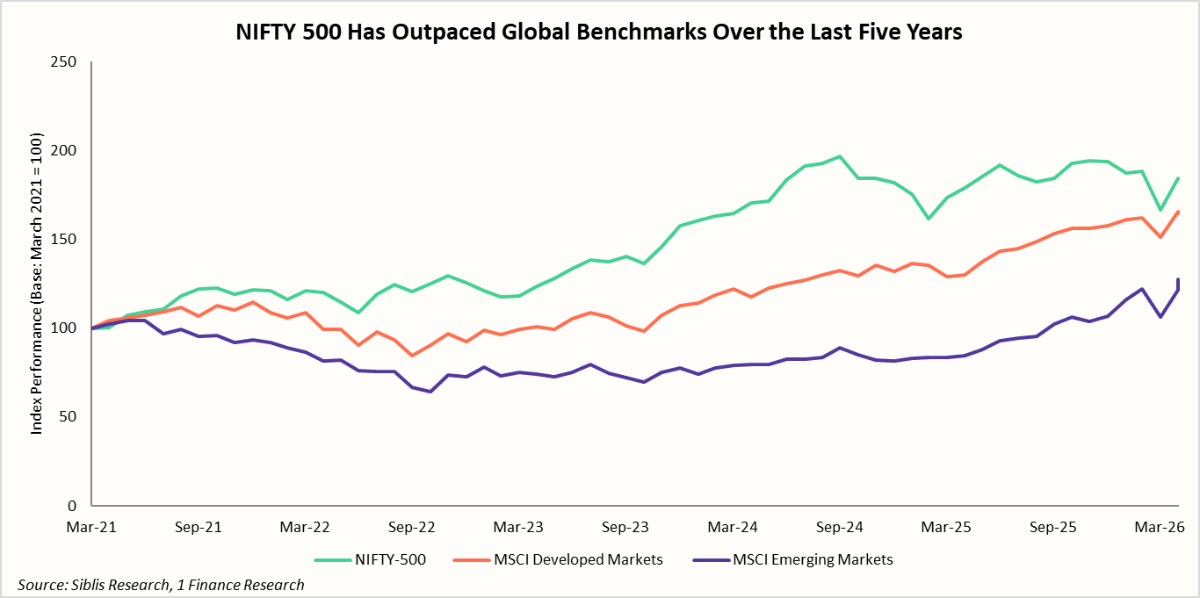
Emerging markets, represented by the MSCI Emerging Markets Index, delivered a weaker and far more volatile cycle, compounding at 7.6% over five years. The index is heavily driven by North Asian technology exporters such as Taiwan (24.8%) and South Korea (18.7%), and followed by other major EM players China (23.1%), India (11.9%) and Brazil (4.7%.
Taiwan’s semiconductor dominance and Korea’s electronics cycle provided strong support, but China’s prolonged property slowdown and weak domestic demand have kept the broader EM performance subdued over the last 5 years. The sharp rebound in 2025 reflected improving global liquidity, a softer dollar, and renewed appetite for cyclical and technology-led EM exposures.
Indian Equities
Indian equities delivered one of the strongest risk-adjusted performances globally initially in the cycle, and the NIFTY 500 has compounded at 10.8% over the last 5 years despite multiple global shocks. Strong earnings growth, sustained capital expenditure, and consistent DII inflows allowed markets to absorb geopolitical uncertainty far better than most emerging economies.
However, the leadership narrative shifted in late 2024 and early 2026. As the chart highlights, broader emerging markets began outperforming Indian equities across all segments post Sep-24. The correction was driven less by earnings weakness and more by valuation compression, INR depreciation, and a tactical rotation of global capital toward relatively cheaper EM opportunities.
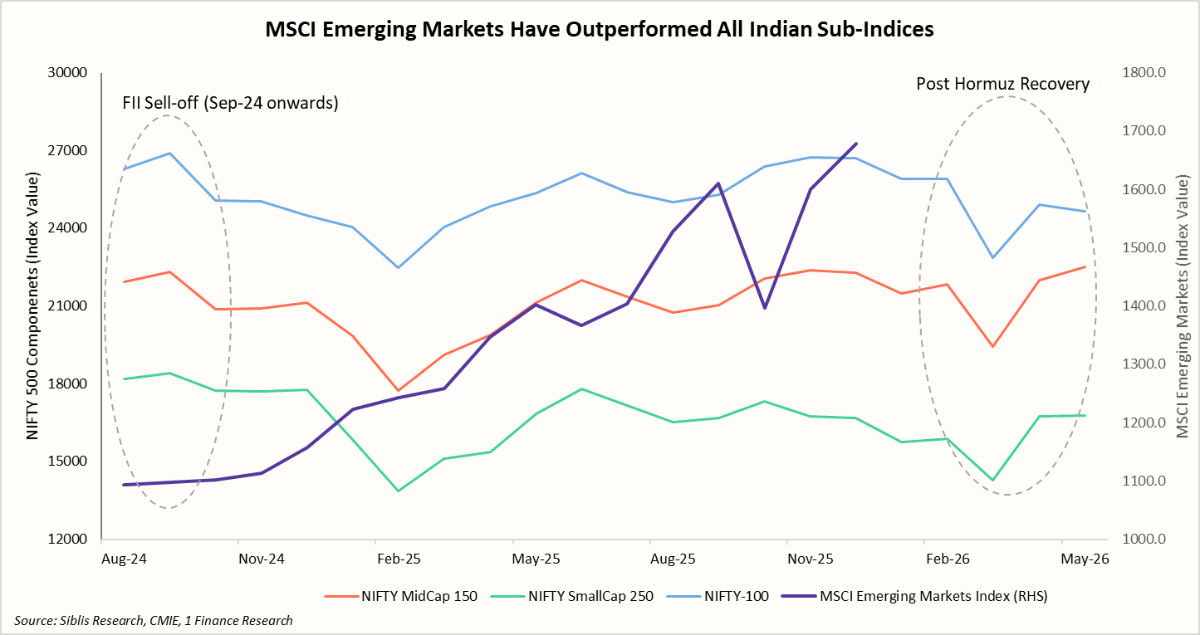
However, since the easing of Hormuz-related tensions in Apr-26, Indian markets have staged a measured recovery, supported by stable earnings delivery and improving risk appetite. The rebound, however, has remained concentrated in select mid- and small-cap pockets, with investors selectively rotating back into fundamentally strong businesses after the sharp valuation reset earlier in the cycle.
REITs and InvITs
The NIFTY REITs and InvITs Index delivered a strong 12% 5-year CAGR, supported by stable rental income, improving occupancies, and resilient infrastructure cash flows. Their steady performance reinforced the appeal of yield-generating real assets within diversified portfolios.
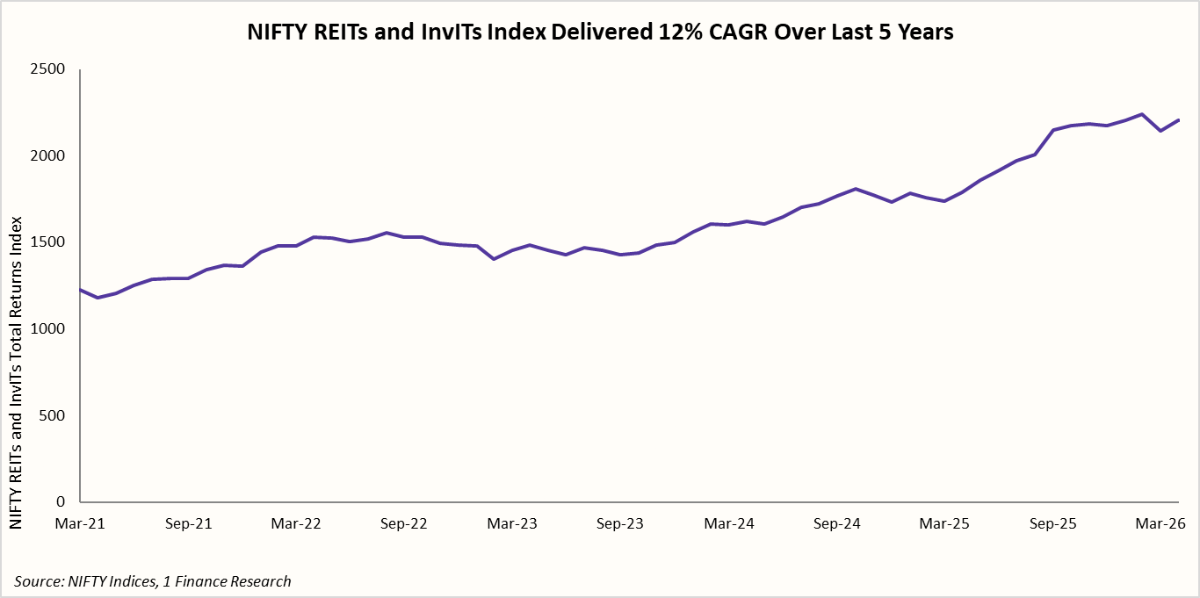
Meanwhile, the 1 Finance Housing Total Return Index offers a more comprehensive view of residential real estate performance by combining both capital appreciation and rental yields across major Indian cities. That broader measure indicates a 9.9% CAGR over 5 years, reflecting steady urban housing demand, post-pandemic recovery in absorption, and improving rental trends across key metropolitan markets.
The Indian economy’s current macroeconomic phase is best understood as a transitory slowdown rather than a structural deterioration. Growth indicators have moderated, and the private sector risk appetite has turned more selective. Historically, such phases tend to favour stability over aggressive return-seeking behaviour, particularly after prolonged periods of equity outperformance.
That is why diversification becomes increasingly important through the cycle. Different asset classes respond differently to changing macro conditions: equities typically perform best during strong recovery phases, while debt, gold, and yield-oriented assets tend to provide strong performance during slowdowns. Asset allocation, therefore, should evolve with the broader economic environment rather than remain static across cycles.
Concluding Remarks
The last five years have shown how quickly market leadership can change. Gold surged during geopolitical uncertainty, Emerging Markets outperformed when their valuations were attractive, while Indian equities corrected despite strong underlying earnings growth. Even within India, leadership rotated sharply across large, mid, and small caps.
In today’s environment of volatile capital flows, slowing global growth, and shifting interest rate cycles, diversification matters more than ever. No single asset class consistently outperforms across every phase of the cycle.
Successful investing is rarely about predicting the next winner. More often, it is about staying diversified, disciplined, and patient through changing market conditions.