
India’s FMCG sector remains one of the most visible parts of the country’s consumption story. It is the fourth-largest industry in India, employs about 30 lakh people, and accounts for roughly 5% of total factory employment. That makes it a useful lens on household spending, rural incomes, and urban demand trends.
This blog looks at how the sector performed in FY26 and what is likely to shape FY27. It first sets out the basic structure of the sector and the key sub-segments within it, then examines recent performance, vs. the broader market (NIFTY 50) and the NIFTY Consumption index. It also explains why the sector’s usual defensive label has not fully protected it this time.
We also look at the outlook for FY27, where growth may still hold up, but more through pricing than volume. That keeps FMCG relevant, but under a very different macro setup from the one investors were used to.
Three Sub-Segments That Make Up the FMCG Sector
The FMCG sector can be subdivided into three broad categories with different demand patterns and cost structures. Some are classic staples, where demand stays relatively stable (inelastic) through the cycle, while others are more exposed to premiumisation, inflation, or input-cost swings.
| Sub-sector | Share within FMCG | Drivers of Demand | Cost & Supply Pressures |
|---|---|---|---|
| Household & personal care | ~50% |
|
|
| Healthcare / OTC | ~31% |
|
|
| Packaged Food & Beverages | ~19% |
|
|
It is a mix of categories that respond differently to the same macro environment. That matters in 2026, because even if overall sector growth holds up, the underlying drivers of demand and margin pressure are unlikely to be uniform across the basket.
Consumption Remained Strong in FY26, But FMCG Stocks Told a Different Story
The NIFTY FMCG and NIFTY India Consumption are the two prominent indices tracking consumer spending, but they capture very different parts of the story. NIFTY FMCG covers 15 pure-play consumer staples companies, which are everyday essentials, and exhibit defensive characteristics and lower volatility than the broader market.
On the other hand, NIFTY India Consumption is a broader index, comprising 30 stocks spanning consumer staples, autos, retail, hospitality, and media sectors. It blends defensive and cyclical exposure, outperforming when discretionary spending accelerates but offers less protection during downturns.
The chart below compares the performance of the NIFTY FMCG Index, NIFTY India Consumption Index, and NIFTY-50 since Apr-18. While NIFTY FMCG largely tracked the broader market until 2024, it subsequently lagged, and stood at 172 (29-May-26) versus 221 for both the NIFTY-50 and NIFTY India Consumption Index.
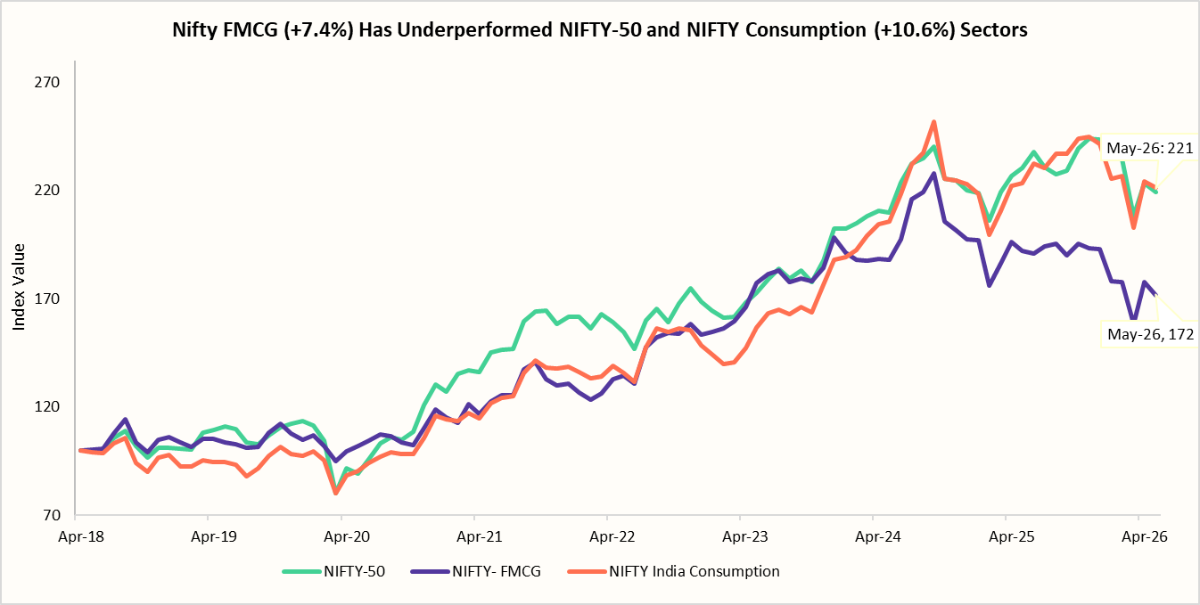
This divergence highlights an important distinction between consumption growth and FMCG stock performance. Despite supportive factors such as healthy monsoons, moderating inflation, lower interest rates, and income-tax relief, much of the incremental household spending flowed towards discretionary categories, such as automobiles, travel, restaurants, retail, and consumer durables, rather than the daily-use staples. As a result, the broader consumption universe benefited more than traditional FMCG companies.
At the same time, the FMCG index composition is heavily weighted towards large, mature businesses with limited exposure to these emerging consumption trends. Combined with already-elevated valuations and moderate earnings growth within these companies, this led investors to rotate towards faster-growing segments of the economy, widening the performance gap after 2024.
When we compare the drawdowns across the two consumption indices, a few clear patterns emerge. During COVID-19, discretionary spending like travel, autos, and big-ticket items were impacted, while everyday essentials (consumer staples) held up much better. At the same time, global crude prices collapsed, which reduced packaging and transport costs and actually helped FMCG margins.
As a result, NIFTY FMCG fell less than the broader consumption index in that phase and recovered faster, reinforcing its image as a relatively safer corner of the market during a demand-led shock.
Recommended for you
Readers also explored

A Mid-Year Check: Whether India is in Flux

World GDP Breakdown 2025: Who Powers the Global Economy?
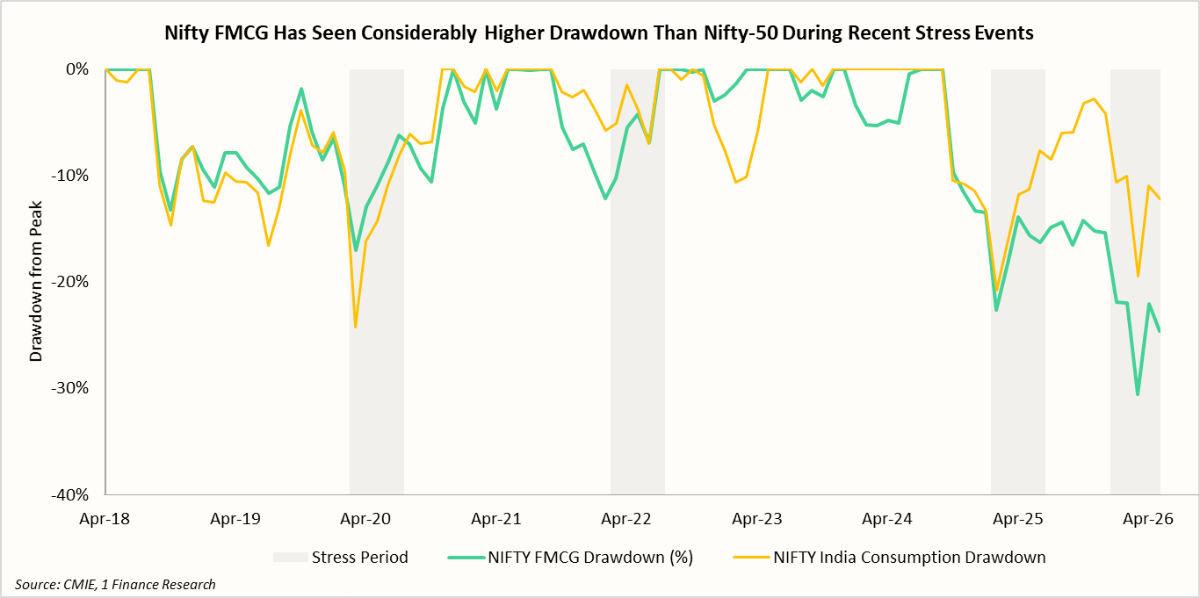
However, during the Russia-Ukraine war and into the Hormuz conflict in 2026, the pressure shifted from the demand side to costs (supply-side). Crude Oil, LPG, and edible oil prices rose, and the rupee weakened. At the same time, foreign investors sold large-cap FMCG names, which added to the weakness.
NIFTY India Consumption was also impacted, but less directly. As its mix includes discretionary items and services, the drawdown was less tied to input-cost shocks like edible oil or packaging. That is why its fall was less, and the recovery was faster.
The table below gives a company-level view of the NIFTY-FMCG sector, and the key takeaway remains that the performance is being driven by a mix of growth, profitability, and valuation discipline. Companies that combine strong revenue growth with a healthy profitability indicator, like Return on Equity tend to stand out more clearly than those relying on just one of these factors.
| Company | NIFTY FMCG Weightage | Industry P/E | P/E | P/B | Return on Equity | 7-Yr Sales Growth % |
|---|---|---|---|---|---|---|
| Personal & Household Care | ||||||
| ITC | 26.4% | 42.6 | 17.2 | 5.0 | 29.3% | 7.2% |
| Hindustan Unilever | 19.3% | 46.2 | 10.3 | 22.3% | 7.3% | |
| Marico | 4.4% | 60.9 | 25.5 | 43.0% | 9.2% | |
| Godrej Consumer | 3.7% | 52.0 | 8.3 | 16.5% | 5.7% | |
| Colgate-Palmoliv | 2.8% | 41.7 | 35.4 | 82.7% | 4.4% | |
| Dabur India | 2.6% | 41.3 | 6.9 | 17.2% | 6.5% | |
| Emami | 0.8% | 22.2 | 6.0 | 27.9% | 5.0% | |
| Packaged Foods & Beverages | ||||||
| Nestle India | 10.3% | 54.5 | 79.5 | 51.7 | 73.2% | 10.8% |
| Tata Consumer | 7.7% | 76.0 | 5.4 | 7.4% | 15.8% | |
| Varun Beverages | 7.1% | 56.1 | 9.1 | 16.3% | 23.0% | |
| Britannia Industries | 6.2% | 49.4 | 24.5 | 53.6% | 8.2% | |
| Patanjali Foods | 1.5% | 29.6 | 4.1 | 12.1% | 16.1% | |
| Alcoholic and Non-Alcoholic Beverages | ||||||
| United Spirits | 3.8% | 40.0 | 50.6 | 10.3 | 21.4% | 4.2% |
| Radico Khaitan | 2.7% | 76.7 | 14.3 | 20.3% | 16.6% | |
| United Breweries | 1.0% | 93.4 | 7.7 | 8.4% | 5.2% | |
At the same time, the table shows that valuation by itself does not determine performance. Some constituents still look expensive relative to their growth, while others may be cheaper but do not yet offer enough profitability to justify a rerating.
Overall, consumption behaviour during periods of stress depends greatly on the nature of the shock. A demand shock usually hurts discretionary spending first, while staples and essentials tend to hold up better. On the other hand, a supply shock works differently; it puts pressure on input costs, margins, and pricing power, which can hurt even defensive sectors like FMCG despite relatively stable underlying demand.
FY27 Growth May Hold, But Margins Will Be Tested
FY27 is likely to be a more uneven year for the FMCG sector than FY26, with supply-side pressure from higher crude prices, packaging and freight costs creating a more demanding operating backdrop. Growth may still hold up, but margin protection and pricing are likely to become more important than in the previous year.
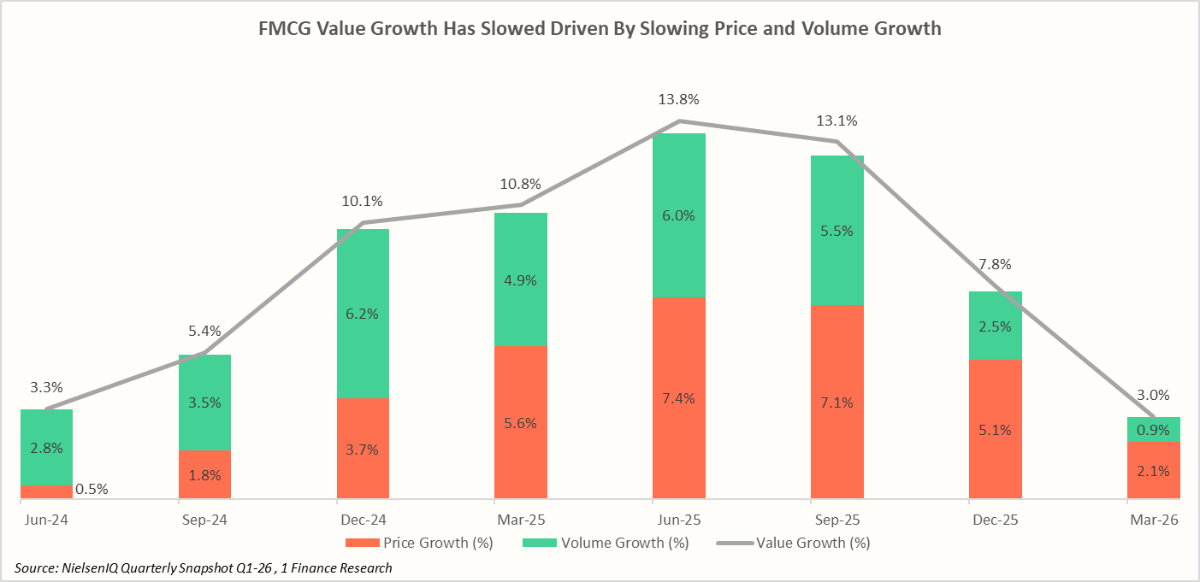
At the same time, demand conditions are also becoming uneven. Nielsen’s FMCG survey also shows that value growth has been slowing as both price-led growth and volume growth moderated through FY26, pointing to weaker underlying momentum. This suggests FY27 could look stable at the headline level, even as volume recovery remains uneven across categories and consumer segments.
Here is how the macro drivers stack up and what they mean for FMCG performance in FY27. The sector is expected to receive meaningful support from policy-led income gains, channel expansion, and rural spending.
| Positive Macro Drivers | How it impacts FMCG Performance |
|---|---|
| 🟢Tax relief and RBI rate cut tailwinds | Income Tax reduction and GST Rationalisation, combined with reduced EMI burdens in FY26, continue to spur disposable incomes, especially in urban areas. This supports consumption, especially within premium categories where demand is more income-sensitive |
| 🟢Quick commerce and modern trade channel expansion | Expansion of online delivery services and large retail stores helps FMCG companies reach more consumers and make products easier to buy, while achieving higher distribution efficiency. |
| 🟢Welfare transfers and rural spending support | Government transfers and rural support programmes like MNREGS provide a floor to consumption, particularly for lower-income households. This matters most for entry-level packs and mass-market categories. |
At the same time, the sector faces several headwinds, including uneven rural demand, monsoon risk, rising input costs, and INR depreciation, all of which could keep pressure on margins and consumption.
| Negative Macro Drivers | How it Impacts the FMCG Sector |
|---|---|
| 🔴Higher raw material, packaging, and freight costs | Rising input costs squeeze margins, especially in categories where companies cannot fully pass on higher prices without hurting demand. This is particularly relevant for food, home care, and personal care businesses. |
| 🔴Weaker monsoon | A poor monsoon affects farm incomes, rural liquidity, and wage growth, weakening one of the key demand supports for the sector. This is a major risk because rural recovery played an important role in FY26. |
| 🔴Persistent INR depreciation | A weaker rupee raises the cost of imported inputs such as edible oils and packaging materials. This adds to margin pressure even if global commodity prices remain stable in dollar terms. |
| 🔴Elevated valuations | Some premium FMCG stocks still trade at high multiples, which limits market upside even if earnings remain stable. In other words, business resilience may not immediately translate into stock-market performance. |
FMCG players usually respond in three broad ways when faced with cost pressures and weakening demand. The first, most direct response is to raise prices selectively, only where strong brands or a better product mix allow companies to pass on costs without hurting demand too much.
The second option is shrinkflation, which includes keeping the product price unchanged while reducing the pack size, which helps preserve affordability and protects volumes in mass-market categories.
A third response is to widen the product offerings through smaller packs, value packs, and targeted promotions and discounts, to prevent customer preference towards private labels, cheaper alternatives, and unbranded options as households become more price-sensitive.
Therefore, FY27 will test how much of the inflation-led cost increase FMCG players can pass on, while also showing whether volumes can still grow as disposable incomes come under stress and consumers become more price-sensitive.
Concluding Remarks
The year FY27 may mark another reminder that the FMCG sector’s defensive reputation is not absolute. The sector has historically held up well during demand-led downturns, but recent years have shown that supply-side shocks, rising input costs, and higher valuations can create meaningful pressure even when underlying demand remains strong.
At the same time, India's consumption landscape is evolving. Incremental spending is increasingly flowing toward discretionary categories such as travel, retail, hospitality, and premium consumption, helping broader consumption indices outperform traditional staples. This does not weaken the FMCG story, but it does mean investors can no longer rely solely on the sector's defensive label as an investment thesis.
The bigger question for FY27 is whether growth remains volume-led or increasingly depends on pricing. Rising input costs, uneven consumption trends, and monsoon-linked risks to rural demand could make the operating environment more challenging. In such a backdrop, the ability to protect volumes, maintain pricing power, and manage costs will be key differentiators.