Last week the Fed raised rates for the first time since 2023, and within hours the market had its familiar reassurance: stocks have historically recovered from first hikes within a year. That history leaves out the question that matters most this time. The AI build-out driving US markets is running up against the cash that funds it, so a growing share comes from borrowing, and each hike raises the cost of the investment itself while lowering what investors will pay for future earnings. If that squeezes the AI trade, India is one of the few markets positioned to benefit, because global investors have spent the year selling it to fund AI positions. The catch is that this holds only if the AI unwind is orderly. In a US recession, India falls too.
Key Takeaways:
|
Rate Hike History Hides Two Very Different Outcomes
We measured the S&P 500 over the 12 months after the first hike of each of the six complete Fed tightening cycles since 1994. The index rose on average by 8.6%, with a median gain of 5.2%. It ended higher in five of the six cycles, and the one loss came in 2022, when it fell 9.1%. Reaching those gains was rarely smooth. Each cycle saw a fall of at least 7% from a recent peak within the year, averaging 12.0%.
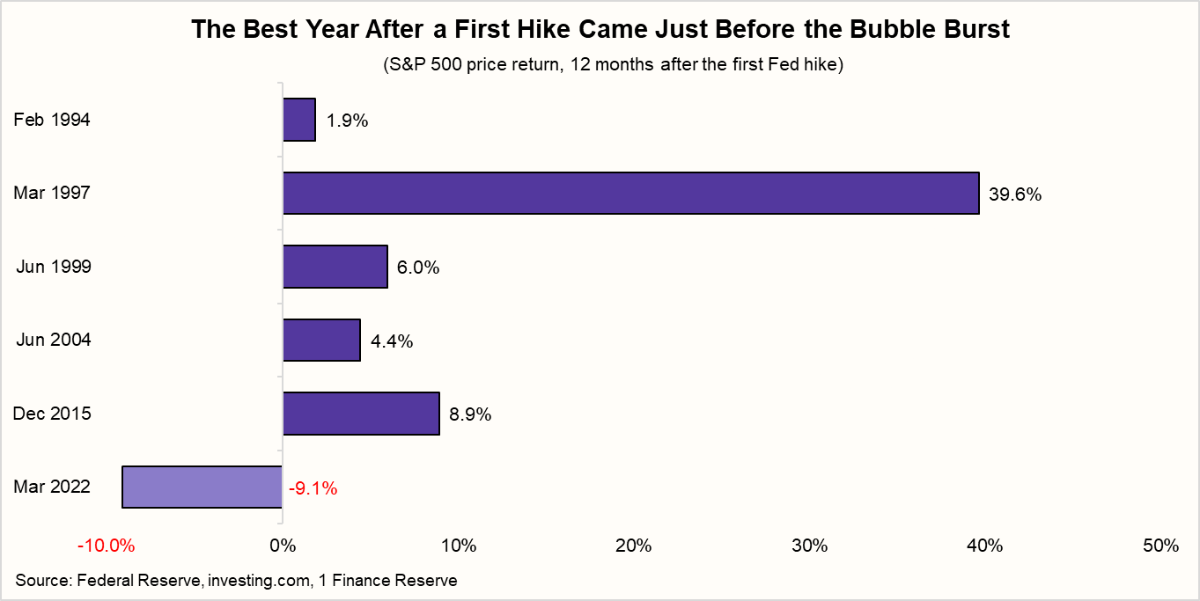
How quickly the Fed tightened made the biggest difference. We classify a cycle as slow if the Fed hiked at no more than every other scheduled meeting on average. That leaves two slow cycles since 1994, 1997 and 2015, and four fast ones.
| Slow Fed Cycles Have Rewarded Patient Investors | |||
|---|---|---|---|
| Cycle type | Cycles | Avg 12m S&P 500 return | Avg max drawdown within 12m |
| Slow | 1997, 2015 | +24.3% | −11.4% |
| Fast | 1994, 1999, 2004, 2022 | +0.8% | −12.3% |
| All cycles | 6 | +8.6% | −12.0% |
The drawdowns were almost the same in slow and fast cycles. Where they differed was the recovery. Investors in slow cycles saw the same 11% to 12% setback as everyone else, but went on to finish the year well ahead. Two caveats apply. The sample is small, and 1997 carries much of the slow-cycle average. On 2015 alone, the slow-cycle return is +8.9%, still well ahead of the fast-cycle figure.
The current cycle has one hike so far. If the next comes in December rather than October, it will follow the slow pattern, as we noted in last week's edition, Three Pressures Are Closing in on India.
The most instructive case is 1997. In the year after the March hike, the S&P 500 rose 39.6%, as belief in the internet overwhelmed higher borrowing costs. The Fed began a new cycle in June 1999, and stocks still gained 6.0% over the following year before the bubble burst in 2000. A strong technology story can outlast tighter money for years.
The closer parallel may be the telecom build-out of the same period, when companies borrowed heavily to lay fibre ahead of demand. That boom ended in the credit market before it ended in the stock market, and that is the risk worth watching now.
The AI Trade Is Becoming a Credit Trade
For most of the rally, the hyperscalers paid for AI out of their own cash flow. Revenue funded capex, capex built capacity, and capacity generated more revenue. Rates mattered mainly through the multiple investors would pay for future earnings. That cushion is now nearly gone.
In the first quarter of 2026, Amazon, Alphabet, Meta, Microsoft and Oracle generated $158 billion from operations and spent $148 billion on capex. Two years earlier, cash flow was more than double capex. Epoch AI's fit to these trends, 23% annual growth in cash flow against 70% in capex, puts it on track to cross around the third quarter of 2026.
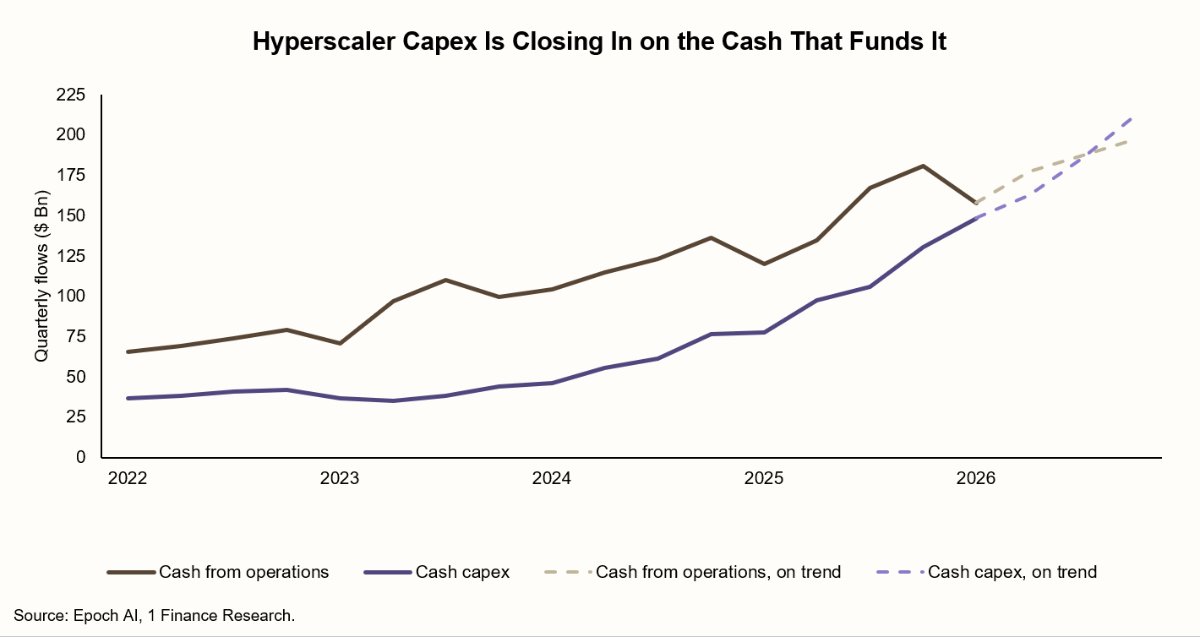
The aggregate hides how uneven this is. On the same trend, Oracle has already crossed, Amazon is crossing now, and Alphabet, Meta and Microsoft follow between early 2027 and late 2028. Microsoft's and Alphabet's surpluses are what keep the aggregate in the black. FactSet expects free cash flow to be near zero or negative in FY26 for every one of the five except those two.
Borrowing did not wait for the lines to cross, because operating cash flow also has to cover dividends, buybacks and everything else. Incremental debt rose from 9% of capex in FY24 to 32% in the twelve months to June 2026, taking aggregate debt to around $700 billion. Equity has returned to the funding mix as well: Alphabet raised $84.75 billion in June 2026, the largest equity transaction ever priced by a listed company.
What matters for rates is the marginal dollar, not the average one. A third of new capex is now funded externally, and that share has been rising for two years. Once a data centre is built with borrowed money, the sequence changes. Debt pays for capex. Capex creates interest expense. Interest expense raises the return that data centre has to earn, and credit spreads price the risk that it won't. Equity valuations come last in that sequence.
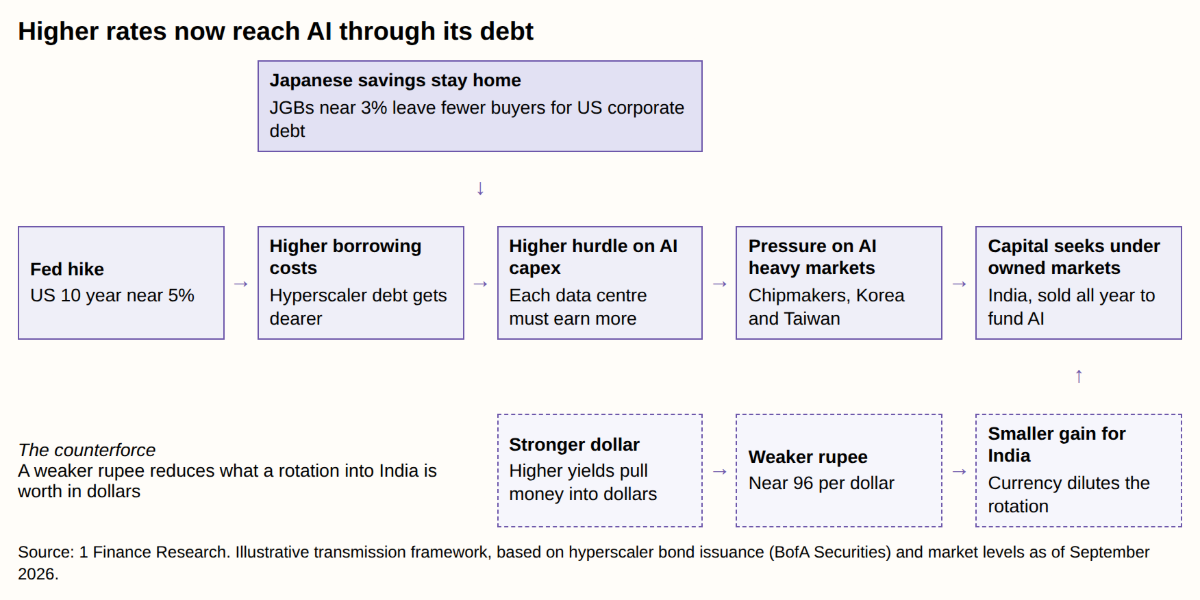
Credit markets have started to make distinctions. S&P downgraded Oracle to BBB− in July 2026, one notch above speculative grade, citing rising capex, negative free cash flow and customer concentration. The other four retain considerable headroom, with debt to EBITDA around 1x or lower, but the direction is the same across the group.
The buyers of that debt are changing too. For two decades, Japanese life insurers and pension funds sent their savings abroad because bonds at home paid close to nothing. With the 10-year JGB now near 3%, its highest since 1996, that calculation has reversed at the margin. On our estimate, a US Treasury hedged back to yen yields about 2.4%, less than a JGB at home. US corporate bonds still pay more after hedging, but their advantage over staying home has narrowed sharply. AI spending is turning to external funding just as one of the steadiest foreign buyers of US bonds has a reason to keep its money in Japan.
The stakes go beyond tech. Apollo's Torsten Sløk notes that without IT-related capex, US corporate investment would currently be negative. How the AI trade unwinds will shape the wider US economy, and that in turn determines whether India gains or suffers.
Global Money Crowded Into AI and Away From India
For much of the past year, global investors treated India as the "anti-AI trade". Chip-heavy markets like South Korea and Taiwan surged on AI optimism, while Indian equities faced high valuations, steady foreign outflows and no listed AI hardware beneficiaries. By May, analysts were attributing most of the money leaving India to three companies: Samsung, SK Hynix and TSMC.
| 💡Did you know? Around 72% of the MSCI Emerging Markets Index's gains this year have come from TSMC, Samsung Electronics and SK Hynix alone. Technology's weight in the index rose from 28.3% in December 2025 to 44.2% by May 2026. |
FPIs have withdrawn ₹2.45 lakh crore from Indian equities in 2026, more than the ₹1.66 lakh crore that left in all of 2025. Indian IT has been hit hardest. By May, the IT index is about 37% below its December 2024 peak as of mid‑September 2026.
Positioning shows up in the returns. So far in 2026, Korea is up 68.0% and Taiwan 66.3%, while the Nifty has fallen 10.2%, or about 16% measured in dollars. India is the only major market to lose ground while AI money moved.
| India Was the Only Major Market That Fell While AI Money Moved | ||||
|---|---|---|---|---|
| Market | Index | 2026 return (as of 22 Sept) | 1-year return | CAPE ratio |
| South Korea | Kospi | +64.0% | +103.1% | 34.3 |
| Taiwan | TWSE | +63.8% | +83.1% | 51.2 |
| United States | S&P 500 | +12.6% | +15.8% | 41.1 |
| India | Nifty 50 | −10.2% | −6.8% | 32.1 |
India is not the cheap option here, and it is not the expensive one either. The Nifty traded at 19.5 times trailing earnings in mid-September, below its own 10-year median of 23.3 but above most emerging markets. On CAPE, which smooths the earnings cycle, India sits at 32.1, below the US at 41.1 and far below Taiwan at 51.2. Taiwan is the outlier at 51.2, the highest CAPE in the table by a wide margin, which is what a crowded theme looks like in a valuation series.
So the case for India does not turn on price. It turns on ownership. India's valuation premium over emerging markets has persisted for years, and foreign investors held the market through that period. What changed in 2025 and 2026 was where the money was needed. If the pull toward AI eases, India is one of the obvious places for underweight investors to rebuild positions.
India Is a Hedge Against AI, Not Against Recession
This distinction decides whether the thesis holds. If AI stocks fall because investors rotate out of an expensive, crowded theme, capital needs somewhere to go, and under-owned markets like India benefit. If AI stocks fall because the US economy slows, global earnings expectations drop, liquidity tightens, and India falls with everyone else. What triggers the fall matters more than how large it is.
| India Gains Only If the AI Unwind Is Orderly | ||||
|---|---|---|---|---|
| Scenario | US AI stocks | Indian equities | Rupee | What advisors should do |
| AI boom continues | Keep rising | Lag | Weakens | Stay diversified, review US concentration |
| AI consolidation | Correct | Outperform on a relative basis | Stable | Add to domestic cyclicals as rotation builds |
| AI unwind with US recession | Fall sharply | Fall | Weakens | Rely on diversification, with debt holding steady |
| Higher rates while AI holds up | Flat to lower | Flat to lower | Weakens | Favour short-duration debt and accrual strategies |
We have already seen a preview of the rotation scenario. In the month to early July, the Nifty rose 3.3% while the Nasdaq slipped 3% and the Kospi fell 13%. FPIs bought Indian equities in July and August, then reversed in September when US yields and oil rose again.
The rupee is the main counterforce in every scenario. Higher US yields strengthen the dollar. With the rupee near 96, against 89.92 at the end of 2025, dollar-based investors have already lost about 6% on the currency this year. We covered the domestic effects in What a Weak Rupee Near 90 Means in 2026.
The Rupee Decided Whether India Beat Wall Street
US history says little about what Indian clients actually own. They hold the Nifty in rupees, and sometimes US tech through feeder funds or LRS. We ran the same test on the Nifty 50, measuring its return in the 12 months after each first hike in both rupees and dollars.
| First Fed hike | S&P 500 (USD) | Nifty 50 (INR) | Nifty 50 (USD) | USD/INR, start to end |
|---|---|---|---|---|
| Feb 1994 | +1.9% | −11.5% | −11.5% | ~₹31.37 |
| Mar 1997 | +39.6% | +8.4% | −1.7% | ~₹35.87-39.53 |
| Jun 1999 | +6.0% | +23.9% | +20.2% | ~₹43.36-44.68 |
| Jun 2004 | +4.4% | +47.5% | +55.9% | ~₹45.98-43.51 |
| Dec 2015 | +8.9% | +5.0% | +3.6% | ~₹66.85-67.78 |
| Mar 2022 | −9.1% | +0.1% | −7.6% | ~₹76.35-82.68 |
| Average | +8.6% | +12.2% | +9.8% |
Across the six cycles, the Nifty averaged +12.2% in rupees and +9.8% in dollars, against +8.6% for the S&P 500. That average hides a split, though. In dollars, India beat the S&P in three cycles and lagged in three. Three patterns stand out.
- The Fed's pace mattered in the opposite direction for India. The Nifty averaged +6.7% in slow cycles and +15.0% in fast ones, the reverse of the US pattern. How quickly the Fed tightens is a signal for US equities; for Indian ones, it has told investors little.
- 1997 is the closest historical match for today's "anti-AI trade". While a single US technology theme drove the S&P 500 up 39.6%, the Nifty fell 1.7% in dollars, a gap of 41 percentage points. When global money chases one theme, markets without it get left behind. That is the pattern the AI trade repeated this year, and it is why an unwind could reverse it.
- The currency decided the dollar outcome. In 2022, when rate hikes hit US tech hardest, the Nifty held flat in rupees (+0.1%). An 8% fall in the rupee turned that into a 7.6% loss in dollars. In 2004, the opposite happened: a 5% stronger rupee lifted a 47.5% rupee gain to 55.9% in dollars.
The protection came with sharper swings. In the year after each first hike, the Nifty's largest fall from its peak averaged 20.7%, against 12.0% for the S&P 500. India has recovered more strongly, but its drawdowns have been deeper. That is why the recession scenario in Table 3 matters.
What This Means for Client Portfolios
This hike is a reason to review US equity exposure, and a poor reason to sell it. We see three priorities for the next three months.
Look through the US allocation. History supports staying invested through a slow hiking cycle, and a single 25 bps hike is not a reason to exit US holdings. Clients who reached the US through Nasdaq-heavy feeder funds, however, now hold what is effectively a concentrated bet on chipmakers and hyperscalers whose spending increasingly depends on outside funding. Advisors should look past the fund label to the underlying holdings.
Strip out the currency. Our 2022 figures show how much the exchange rate can change an investor's result. A rupee down about 6% this year has flattered US returns for Indian investors. Before adding to US tech, it is worth working out how much of the past year's gain came from company earnings and how much came from the currency. Trimming concentrated positions now locks in gains that a rupee recovery would reverse.
Hold India through the lag. India's underperformance came from global money funding AI trades elsewhere, not from a deterioration in Indian earnings. An orderly AI unwind is when that money looks for a new home.
The limit to keep in mind is that India cushions an AI correction but falls in a US recession. Diversification and debt still do the heavy lifting.
Indian IT. The sector lost out when capital chased AI hardware, and it gains from a weaker rupee. We would watch it rather than buy it until enterprise AI spending clearly reaches Indian services firms.
Domestic cyclicals and financials. These stand to gain most if the rotation happens, since they make up most of what foreign investors sold. The constraint is at home. With the RBI under pressure to tighten, rate-sensitive financials face a harder next quarter than the global argument alone suggests. Our Equity Market Optimism Index tracks whether domestic sentiment is holding up while foreign flows remain uncertain.
Our Rotation Monitor
We will track five signals to judge whether the rotation scenario is building. Together they show what would support the thesis and what would break it.
| Five Signals Will Decide the Rotation | |||
|---|---|---|---|
| Signal | Now | Supports the India case | Breaks the India case |
| US 10-year yield | ~5.0% | Eases below 4.75% | Holds above 5.25% |
| Hyperscaler 2027 capex guidance | Due late October | Cut or held flat | Raised again |
| Chipmakers vs hyperscalers | Chipmakers lagging since 14 Sep | Gap persists | Chipmakers retake highs |
| USD/INR | ~96 | Stable below 96 | Sustained above 97 |
| FPI equity flows | Net selling in September | Two straight weeks of buying | Selling continues after an AI correction |
Today the signals are mixed. Yields remain high, and FPIs are still selling. On the other side, the split between chipmakers and hyperscalers since 14 September suggests markets are already questioning AI spending. We assign a Medium probability to a sustained FPI return to Indian equities over the next six months, and will revisit that call as each signal moves.