India's real GDP grew 7.8% year on year in Q1 FY27, the April to June 2026 quarter, ahead of the Reserve Bank of India's 7.0% projection. Real gross value added, which measures what producers added before taxes and subsidies, grew faster at 8.2%.
The headline is strong. The composition is more interesting. Investment grew at nearly twice its year-earlier pace, from 5.8% to 11.9% and reached its highest share of the economy since the national accounts were rebased. Household spending held firm rather than accelerating. Agriculture slowed, mining shrank, and imports outpaced exports in value terms even as export volumes surged.
| What Changed Between Q1FY26 and Q1FY27 | |||
|---|---|---|---|
| Indicator | Q1 FY26 | Q1 FY27 | Change |
| Real GDP growth | 6.9% | 7.8% |  +0.9 pp +0.9 pp |
| Nominal GDP growth | 8.1% | 10.3% | +2.2 pp |
| Real GVA growth | 7.0% | 8.2% | +1.2 pp |
| Gross Fixed Capital Formation (GFCF) | 5.8% | 11.9% | +6.1 pp |
| Private Final Consumption Expenditure (PFCE) | 6.8% | 7.1% | +0.3 pp |
| Government Final Consumption Expenditure (GFCE) | 4.5% | 4.3% |  −0.2 pp −0.2 pp |
| Exports | 6.0% | 12.0% | +6.0 pp |
| Imports | 5.3% | -1.1% | −6.4 pp |
GDP Growth by Sector
Services and industry accelerated together this quarter, which does not always happen. The tertiary sector grew 10.0% and the secondary sector 8.6%, while the primary sector managed only 2.9%.
| Sector-wise GDP Growth | |||
|---|---|---|---|
| Sector | Q1 FY27 (%) | Q1 FY26 (%) | Key Drivers & Implications |
| Agriculture, Livestock, Forestry & Fishing | 3.6 | 4.4 (-0.8) | Foodgrain growth eased to 4.8% from 5.0%, with sharper slowdowns in rice and wheat, pointing to softer agricultural momentum. |
| Mining & Quarrying | −2.4 | 12.4 (−14.8) | Mining IIP fell to −1.2% from +3.5%, making mining the biggest drag within the primary sector. |
| Primary Sector | 2.9 | 5.3 (−2.4) | Agriculture moderated while mining contracted, weakening the sector's contribution to growth. |
| Manufacturing | 9.2 | 8.3 (+0.9) | Capital-goods IIP rose to 15.2% from 8.8%, signalling stronger industrial and investment activity. |
| Electricity, Gas, Water & Utilities | 8.9 | −1.8 (+10.7) | Electricity IIP turned to 9.3% growth from −1.5%, marking a strong turnaround in utility activity. |
| Construction | 7.7 | 5.2 (+2.5) | Cement and infrastructure-goods production strengthened, supporting continued construction activity. |
| Secondary Sector | 8.6 | 6.1 (+2.5) | Manufacturing, construction and utilities all strengthened, making industry a stronger growth engine. |
| Trade, Hotels, Transport & Communication | 8.5 | 9.8 (−1.3) | Air traffic and railway freight indicators moderated, pointing to softer momentum in transport-linked services. |
| Financial, Real Estate, IT & Professional Services | 12.1 | 8.8 (+3.3) | The fastest-growing major GVA segment, providing a strong lift to overall services growth. |
| Public Administration, Defence & Other Services | 7.5 | 4.6 (+2.9) | Stronger government-related activity supported the segment, with fertilizer subsidy expenditure rising 57.6%. |
| Tertiary Sector | 10.0 | 8.0 (+2.0) | Stronger financial and professional services more than offset the moderation in trade and transport. |
What Drove Growth on the Demand Side
The demand side shows the clearest change in the growth mix. Consumption remained steady, while investment accelerated sharply, becoming the stronger driver of growth in Q1 FY27.
Why did real imports fall?
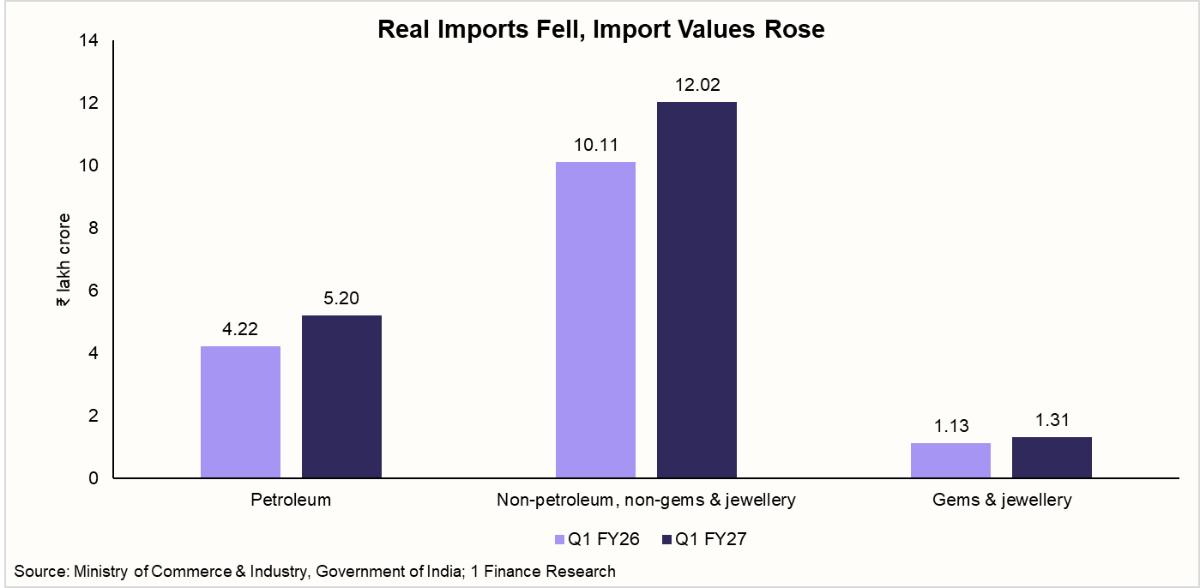
Real imports contracted 1.1% in Q1 FY27, compared with 5.3% growth a year earlier. Yet imports rose sharply in value terms. Current-price imports of goods and services increased by about 30.9%, while merchandise imports rose 19.9%, from ₹15.45 lakh crore in Q1 FY26 to ₹18.53 lakh crore in Q1 FY27.
The increase was broad-based across major import categories. Petroleum imports rose from ₹4.22 lakh crore to ₹5.20 lakh crore, while non-petroleum, non-gems and jewellery imports increased from ₹10.11 lakh crore to ₹12.02 lakh crore. Gems and jewellery imports rose from ₹1.13 lakh crore to ₹1.31 lakh crore.
The gap between rising import values and falling real import growth points to a strong price effect rather than a comparable decline in the value of goods and services purchased. Energy prices were an important part of this pressure: MoSPI's producer-price index for crude petroleum and natural gas rose 58.0% YoY, compared with a 15.9% decline a year earlier. This is not a direct measure of import prices, but it provides supporting evidence of the sharp increase in energy prices during the quarter.
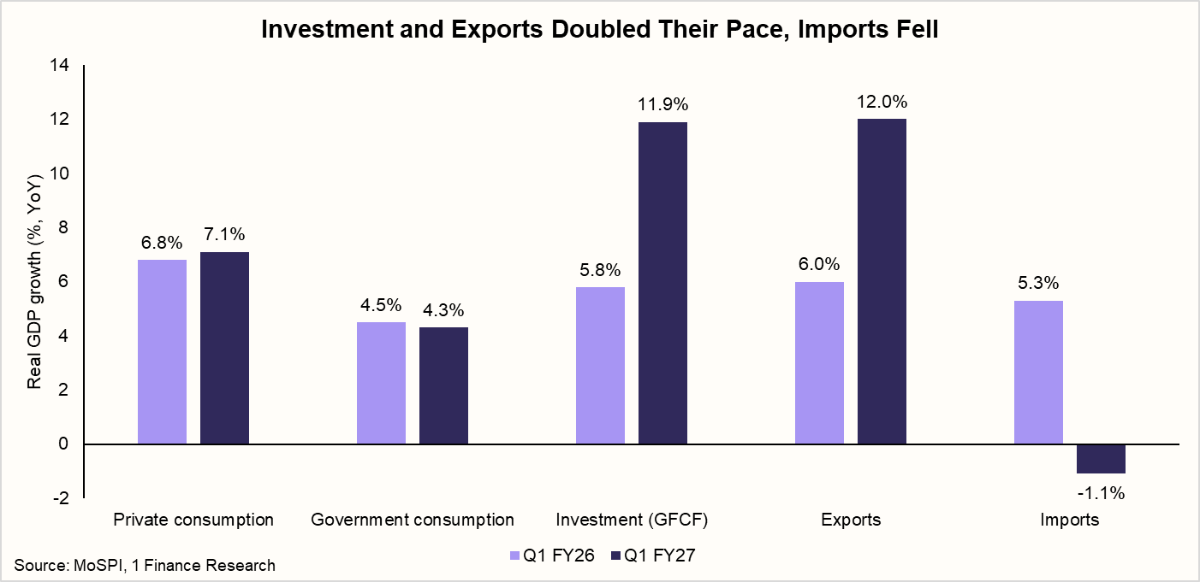
Investment nearly doubled its growth rate from a year earlier, while exports did the same. Real imports moved from growth into outright contraction, allowing net exports to provide a positive contribution to headline real GDP growth. GFCF grew 11.9% in Q1 FY27, compared with 5.8% a year earlier, while exports grew 12.0% against 6.0%. Real imports contracted 1.1%, compared with 5.3% growth a year earlier.
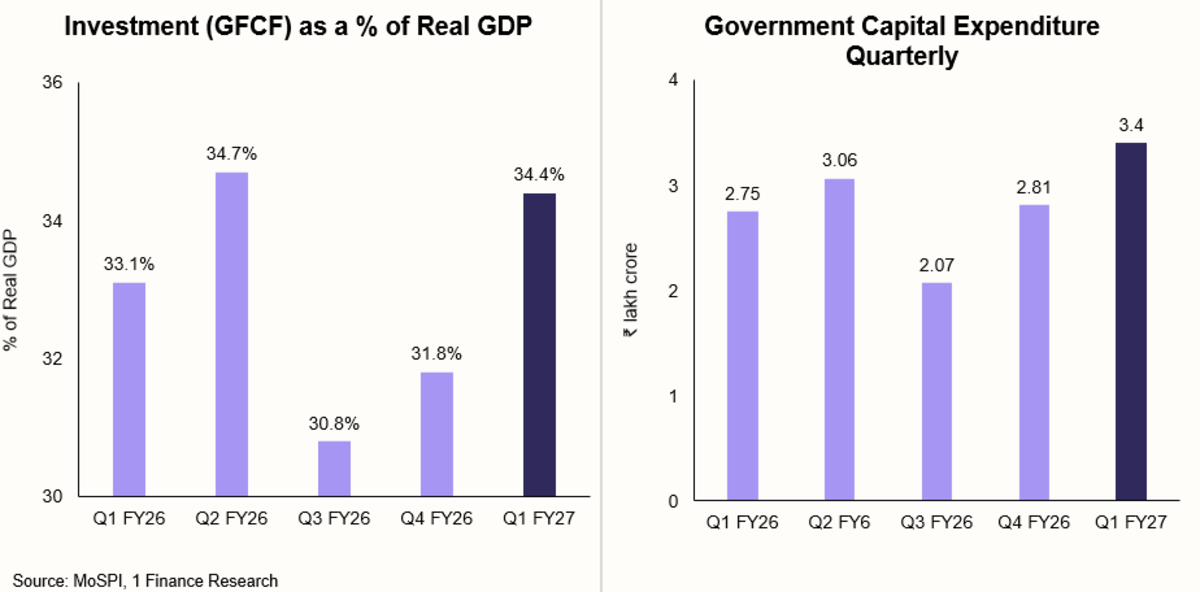
Real GFCF usually falls from Q4 into Q1, but that seasonal decline disappeared this year. Real GFCF edged up from ₹27.90 lakh crore in Q4 FY26 to ₹27.96 lakh crore in Q1 FY27, while its year-on-year growth accelerated to 11.9%. This points to unusually resilient investment activity at the start of the financial year.
The shift is also visible in the investment ratio. GFCF rose to 34.4% of real GDP in Q1 FY27, from 33.1% a year earlier and 31.8% in Q4 FY26. Alongside this, Union Government capital expenditure reached ₹3.40 lakh crore in Q1 FY27, up from ₹2.75 lakh crore a year earlier and ₹2.81 lakh crore in Q4 FY26.
💡 What this means in practice A 34.4% investment share means roughly one rupee in three of India's output is now going into building productive capacity rather than being consumed today. Capacity built this year shows up as output, jobs and corporate revenue over the following several years, which is why the composition matters as much as the headline rate. |
Was Q1 Stronger Than Its Usual Seasonal Dip?
Set against the previous quarter, India's GDP looks like it shrank. Real output was ₹81.36 lakh crore in Q1 FY27 against ₹87.77 lakh crore in Q4 FY26, a 7.3% sequential fall. That number, on its own, is misleading.
India's economy is seasonal. The January to March quarter is mechanically the strongest every year, as government spending is front-loaded before the fiscal year ends, corporate activity peaks and the harvest lifts agriculture. April to June always restarts the cycle from a lower base. Last year's equivalent step-down was 7.4%. This year's is 7.3%. Nearly identical, and neither says anything about momentum.
💡 The comparison that actually works GDP normally falls from Q4 to Q1 because of seasonal patterns. So, instead of looking at this year's fall alone, we compare it with last year's Q4-to-Q1 fall. The gap between the two, in percentage points, is what this blog calls seasonal divergence. Positive means a component fell less than it usually does, so it outperformed its own seasonal pattern. Negative means it fell more than usual. |
Capex Rose While the Fiscal Deficit Remained Moderate
Government consumption grew more slowly than any other demand component, but that understates the state's role. Consumption spending and capital spending are different things, and capital spending rose sharply. Through July, the Union government had spent ₹4.51 lakh crore on capital projects against ₹3.5 lakh crore in the same period a year earlier.
The deficit is also running cooler than last year. At the end of July it stood at 26.8% of the full-year budget estimate, against 29.9% at the same point a year ago, helped by stronger net tax collection.
| Union Government Accounts Through July 2026 | |
|---|---|
| Indicator | April to July FY27 |
| Total receipts | ₹13.07 lakh crore |
| Net tax revenue | ₹8.45 lakh crore |
| Total expenditure | ₹17.62 lakh crore |
| Capital expenditure | ₹4.51 lakh crore |
| Revenue expenditure | ₹13.11 lakh crore |
| Interest payments | ₹4.27 lakh crore |
| Major subsidies | ₹1.54 lakh crore |
| Fiscal deficit | ₹4.55 lakh crore (26.8%) |
One fiscal signal sits inside the GDP data itself. GDP equals GVA plus net taxes on products, which is taxes collected minus subsidies paid. Net taxes grew only 3.9% in real terms against 8.2% GVA growth, and that gap is why headline GDP growth came in below GVA growth. Fertiliser subsidy spending rose 57.6% over the year, enough on its own to move the wedge.
India's Investment Cycle in 2026
The investment story is more convincing than a single national-accounts line because factory output moved the same way. Capital-goods production accelerated across every category.
| Capital Goods Production Gained Momentum | ||
|---|---|---|
| Industrial production category | Q1 FY26 | Q1 FY27 |
| Electrical equipment | 9.7% | 27.0% |
| Other transport equipment | 3.8% | 19.5% |
| Capital goods, overall | 8.8% | 15.2% |
| Computer, electronic and optical products | 8.8% | 12.4% |
| Machinery and equipment | 6.6% | 9.1% |
| Infrastructure and construction goods | 6.1% | 7.2% |
Two supporting signals point the same way. Imports of machinery and equipment rose 51.5% over the year, which is what a genuine capex build looks like in trade data. Commercial vehicle sales, flat a year earlier, grew 18.3%. Momentum also carried into July, when capital-goods output grew 16.1%.
Credit conditions improved alongside it, and not only for industry.
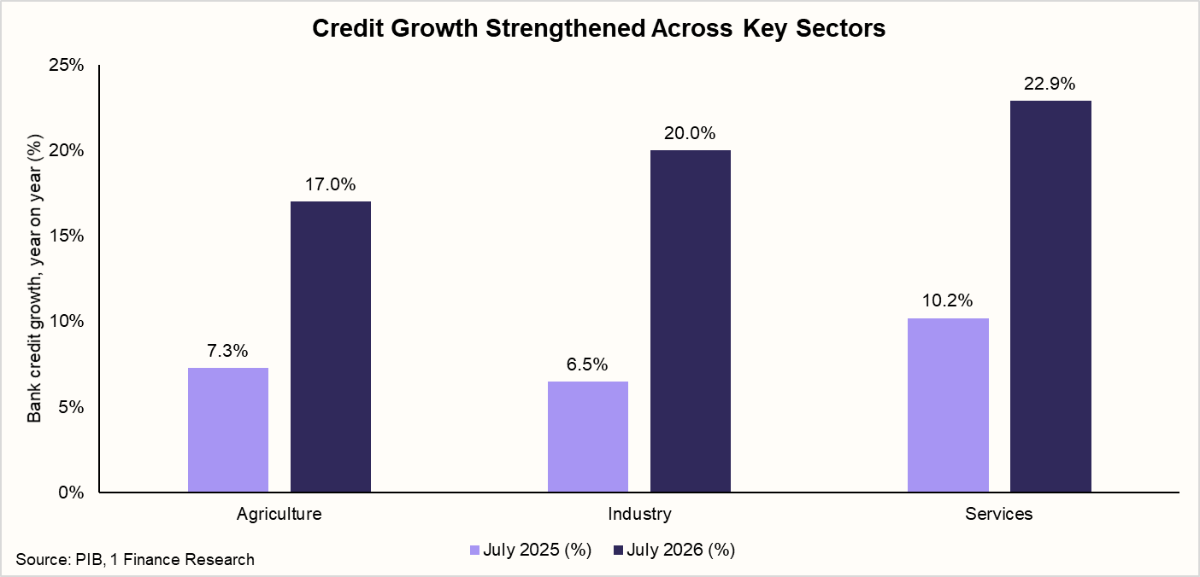
One quarter does not establish a multi-year capex cycle. What it establishes is that investment, capital-goods output, equipment imports and credit are all moving in the same direction at the same time, which is harder to dismiss than any one of them alone. Durability is the open question.
Inflation, Jobs and Household Demand
Household spending grew 7.1%, slightly ahead of the 6.8% a year earlier. Consumption is a stable base for growth here rather than the engine, and reading the headline as a consumer boom would misread the quarter.
The household picture is mixed rather than weak. Food prices are rising faster than the overall basket, which squeezes lower-income households hardest because food takes a larger share of their budget. The labour market, on the other hand, improved on all three headline measures in July.
| What Is Driving Household Demand? | |||
|---|---|---|---|
| Indicator | Latest | Change | Signal for households |
| Private consumption growth | 7.1% | 6.8% YoY | Steady demand, not a boom |
| Food inflation | 5.52% | 1.07 pp above headline inflation (4.45%) | Greater pressure on household budgets |
| Labour force participation | 55.4% | 54.4% (June) | More people participating in the workforce |
| Worker population ratio | 52.5% | 51.4% (June) | Employment participation improved |
| Unemployment rate | 5.1% | 5.5% (June) | Joblessness eased |
Retail inflation sits above the 4% medium-term target but inside the 2% to 6% tolerance band, and the pressure is concentrated in food rather than spread across the basket. That distinction matters, because broad-based inflation would force a policy response that food-driven inflation may not.
One caution on jobs. The monthly labour figures improved, but they are a single unadjusted month, and the annual reading moved the other way, with FY26 unemployment ticking up for the first year-on-year rise in several years even as growth stayed strong. The quarterly labour bulletin will give a cleaner read than either. A strong GDP number is not a statement about any individual household's income or job security.
India GDP Outlook for FY27
| GDP Outlook For FY27 | |||
|---|---|---|---|
| Growth driver | Q1 FY27 growth | Outlook | What will determine the next two quarters |
| Private consumption | 7.1% | Steady, with room to improve | Real incomes, rural demand and food inflation |
| Investment | 11.9% | Strongest domestic growth engine | Whether private capex follows public capex and credit growth |
| Government consumption | 4.3% | Limited support | Fiscal consolidation and government spending priorities |
| Exports | 12.0% | Positive but externally driven | Global demand and trade conditions |
| Imports | -1.1% | Potential drag on future growth contribution | Recovery in domestic demand and investment could lift import volumes |
| Overall expenditure mix | GDP 7.8% | Positive, but increasingly dependent on investment | Fiscal consolidation and government spending priorities |
What This Means for Investors and Advisors
- The investment cycle deserves the closest watch. GFCF growth accelerated to 11.9% from 5.8%, making sustained capex not the 7.8% headline, the key test for the next phase of growth.
- Growth is becoming more investment- and services-led. Manufacturing and financial, real estate, IT and professional services are driving activity, while consumption remains steady. This matters for sector allocation, but argues against concentrating portfolios around a single growth theme.
- Credit growth needs to translate into earnings and capex. Industry and services credit grew 20.0% and 22.9% in July. The next signal to watch is whether faster credit produces sustained investment, production and corporate earnings.
- Oil remains a key portfolio variable. Higher crude prices can feed through to inflation, corporate margins and the trade balance, making energy prices relevant across both equity and fixed-income assumptions.
- Do not extrapolate one strong quarter. Q1 provides evidence of stronger momentum, but a durable investment cycle needs to show up in subsequent quarters. Portfolio positioning should therefore distinguish between current momentum and a confirmed trend.
- Keep household outcomes separate from GDP. Strong aggregate growth does not automatically translate into equivalent income or consumption growth for households. This distinction matters when setting return, spending and retirement assumptions for clients.
Conclusion
India entered FY27 with growth that was strong and broad. Services and industry accelerated together, investment moved from recovery toward expansion and reached a record share of the economy, and the labour market improved. Agriculture was the clear soft spot, food inflation is running ahead of the headline, and a rising oil bill is widening the trade gap even as export volumes climb.
The headline number is not the most informative part of this release. The composition is. Whether this quarter reads as a turning point or a peak depends on three things: whether investment holds through the next two quarters, whether agriculture recovers, and whether crude stays contained.