In January, we ranked global trade protectionism as the highest risk to Indian portfolios in 2026 and put climate near the bottom of the board. Six months on, the additional tariff Indian goods pay entering the United States has fallen from 50% to 10%, and the live threat to our inflation forecast is a failed monsoon.
The radar was not wrong about what could happen. It was wrong about which risks would actually reach Indian portfolios, and in one case it was pointing in almost exactly the opposite direction. This is the half-yearly regrade, including the calls we missed.
How The Board Has Moved Since January
| Risk | Jan 2026 | Aug 2026 | What changed |
|---|---|---|---|
| Global Trade Protectionism | 🔴 High | 🟠 Medium | Tariff level collapsed, architecture rebuilt twice |
| Middle East Conflict | 🔴 High | 🔴 High | Realised as war, not spikes |
| Divergent Global Rate Cycle | 🟠 Medium | 🔴 High | Cutting cycle ended, hikes now priced |
| US-China Tech Decoupling | 🟠 Medium | 🔴 High | AI competition hardened |
| Monsoon And Food Inflation | 🟡 Low | 🔴 High | El Niño delivered the fifth driest June since 1901 |
| AI Capex Concentration | 🟠 Medium | 🟠 Medium | Reframed from earnings disruption to market structure |
| US Debt Sustainability | 🟠 Medium | 🟠 Medium | Folded into central bank independence |
| Global recession | 🟠 Medium | 🟡 Low | Growth held up better than we expected |
| Global inflation resurgence | 🟠 Medium | — | Distributed across energy, monsoon and rates |
| Election policy shocks | 🟡 Low | 🟡 Low | US midterms now inside the window |
| Chinese Overcapacity And Import Diversion | Not Tracked | 🟠 Medium | New |
Five rows moved by a full grade, one is new, and four came off the board into the watch list or into other rows. That is a high error rate for a six-month-old framework, and worth saying plainly rather than quietly rerating.
The August 2026 Risk Map
Our likelihood ratings assess the probability of each risk materially affecting Indian portfolios within the next six months, which is the horizon that matches this publication cycle.
| Risk Event | Description & Our 2026 View | Probability in 2026 |
|---|---|---|
| Middle East Conflict | Rated High in January and it materialised, though we modelled episodic spikes rather than sustained war. The June memorandum has broken down, Hormuz stays shut pending US concessions, and the Red Sea blockade exposes a second chokepoint. With 88% crude import dependence, this is the shortest transmission path on the board. | 🔴 High |
| US-China Tech Decoupling | Upgraded from Medium. Both sides now treat AI leadership as a national security matter. For India, the transmission runs two ways: negative for IT services exposed to a slowing global technology capex cycle, positive for domestic electronics manufacturing and the China plus one supply chain shift. | 🔴 High |
| End Of The Global Easing Cycle | Repriced from Medium. The January framing of divergent cuts no longer describes the environment. Both the Fed and the RBI are on hold with risk tilted toward tightening. Long duration has no catalyst until the December-quarter inflation peak passes. | 🔴 High |
| Monsoon And Food Inflation | The most India-specific risk on the board and the one we underrated most. The sowing window damage has already occurred regardless of August recovery. Watch the first kharif output estimates after the season closes on 30 September, and the vegetable and pulses components of CPI through the December quarter. | 🔴 High |
| Global Trade Protectionism | Downgraded from High, but less comfortably than a month ago. India's US duty fell from 50% to 10% across three legal architectures in twelve months. On 7 August the Senate voted 86-11 to authorise tariffs of up to 100% on major buyers of Russian energy, India among them. The level risk collapsed. The regime stability risk did not. | 🟠 Medium |
| AI Capex Concentration | Reframed rather than rerated. Our January concern was AI disrupting Indian IT earnings. The live risk is that concentrated US capital spending, funded increasingly by debt, makes global risk appetite fragile, reaching India through foreign flows first. | 🟠 Medium |
How These Risks Hit Markets
The board above sets out what we think will happen. The table below sets out where it lands. Each row traces a single risk through to the assets we expect to move first.
| Risk | Impact on global asset classes | Impact on Indian asset classes |
|---|---|---|
| Middle-East Conflict | Brent Crude (USD) ▲ Global Energy Equities ▲ Global Shipping ▼ Global High-Yield Bonds ▼ | INR/USD ▼ Gold (INR) ▲ Indian Oil Marketing Companies (OMCs) ▼ Indian Aviation Sector ▼ |
| US-China Tech Decoupling | Chinese Tech Equities ▼ US Semiconductor Equities ▲ US AI Equities ▲ CNY/USD ▼ | Indian IT Sector ▼ Domestic Electronics Manufacturing ▲ Indian Capital Goods ▲ FPI Flows in Manufacturing ▲ |
| End Of The Global Easing Cycle | US Government Bonds ▼ EM Sovereign Bonds ▼ USD ▲ | Indian Government Bonds ▼ Indian Bank Equities ▼ Real Estate and NBFCs ▼ Short-Duration Debt ▲ |
| Monsoon And Food Inflation | Global Agricultural Commodities ▲ Global Edible Oil Complex ▲ | Indian FMCG ▼ Indian Government Bonds ▼ Indian Fertiliser Sector ▲ |
| Global Trade Protectionism | US Consumer Durables ▼ US Retail ▼ Chinese Export Equities ▼ US Government Bonds ▲ | Indian IT Sector ▼ INR/USD ▼ Gold (INR) ▲ Indian Pharma Sector (export-oriented) ▼ |
| AI Capex Concentration | US AI Equities ▼ US Semiconductor Equities ▼ Global High-Yield Bonds ▼ | Indian IT Sector ▼ FPI Equity Flows ▼ Indian Large Cap Equities ▼ |
The Trade Win Has A Second Half
India's additional US duty fell from 50% to 10% in six months, across three separate legal architectures. The 18% agreed in February collapsed when the Supreme Court ruled that emergency powers do not authorise presidential tariffs. A temporary global tariff filled the gap until 24 July, when USTR replaced it with forced labour duties of 10% or 12.5%, set by each country's own import controls.
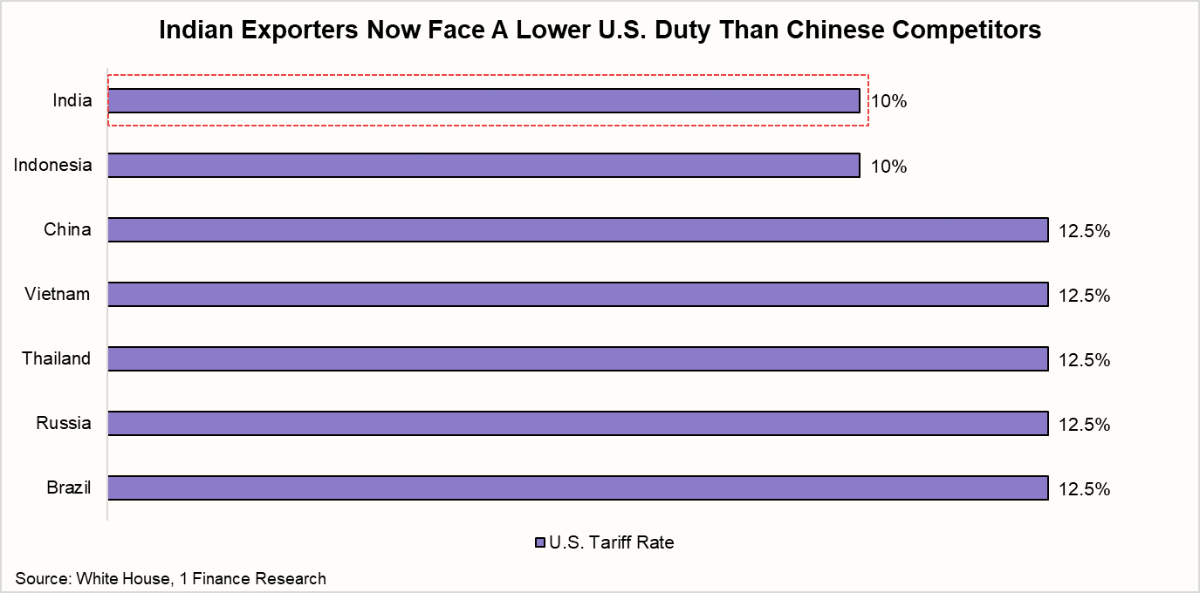
India was proposed at 12.5% and landed at 10%. China, Vietnam, Brazil and Russia pay 12.5%. For the first time in this cycle, Indian exporters face a lower US duty than their principal Asian competitors.
| 💡DID YOU KNOW India's tariff rate was not negotiated down. It amended its Foreign Trade Policy to restrict forced labour-linked imports, which moved it into the 10% tier alongside the UK and Mexico. A domestic regulatory change delivered what a year of bilateral negotiation could not. |
That is where the story stops being straightforwardly good. On 7 August the Senate voted 86-11 to authorise tariffs of up to 100% on the largest buyers of Russian energy, India among them. The bill is not law; the tariff is discretionary and carries a presidential waiver, and it goes to the House on 31 August.
What it establishes is that India's energy sourcing is now a trade policy variable. That is the connection this radar did not draw in January.
Where The Two Biggest Risks Meet
Russia's share of India's crude has just reached a record. The path was not a straight line: 2% before the Ukraine war, roughly a third by FY25, then below 25% between December 2025 and February 2026 as sanctions on Rosneft and Lukoil bit, before rebounding to 42.6% by volume in May and a reported 48% by July.
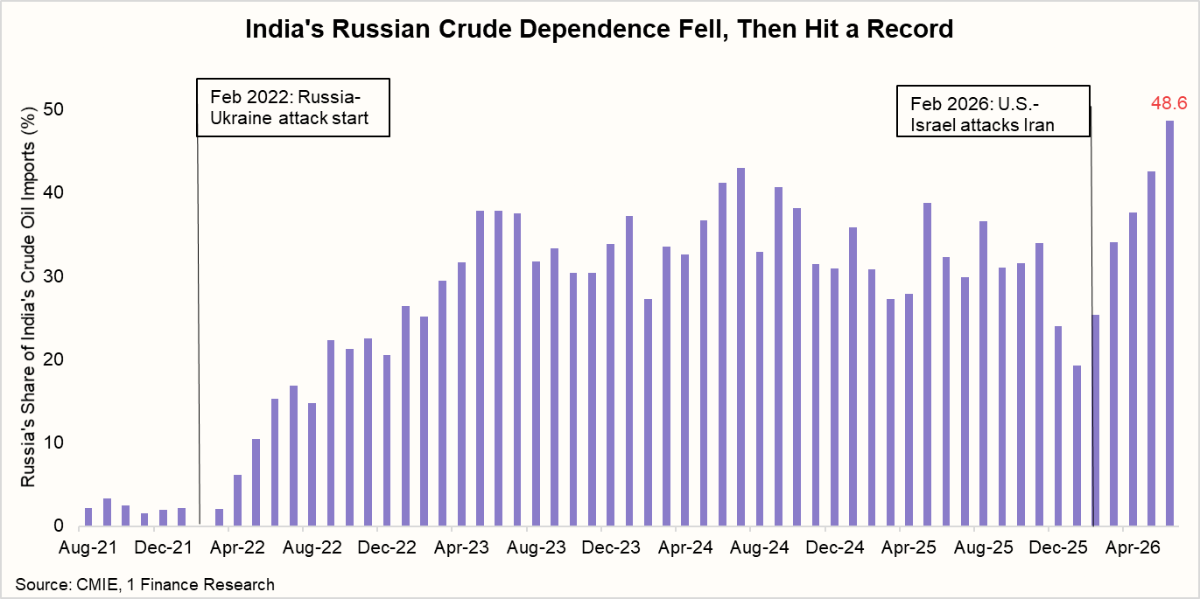
India's reliance on Russian energy peaked in the same month the Senate authorised tariffs on the countries buying it.
That discount is now a liability in two directions. Reduce purchases to stay clear of the tariff authority, and India replaces discounted barrels with market-priced ones in a market already tight because Hormuz has not reopened. Keep buying, and it carries contingent tariff risk across pharmaceuticals, engineering goods and textiles. The energy row and the trade row are the same exposure measured from two ends, and the cost of resolving one is paid in the other.
The Easing Cycle Ended, And Nobody Rang A Bell
Our January framing was a divergent cut cycle. That framing is now backwards, and this is the single largest rating change on the board.
The Federal Reserve has held at 3.50% to 3.75% all year. Markets are pricing a 25 basis point hike in September, with Chair Kevin Warsh signalling willingness to move if inflation runs hot. The 30-year Treasury sits at 5.28%. Investors who entered 2026 pricing two and a half cuts are now pricing one hike.
India mirrors this. The RBI held at 5.25% in August for a fourth consecutive meeting with a neutral stance. CPI reached 4.38% in June, the highest since December 2024 and above the 4% target for the first time in 17 months. The RBI projects FY27 inflation peaking at 5.9% in the October to December quarter, while raising its FY27 growth forecast to 6.7%.
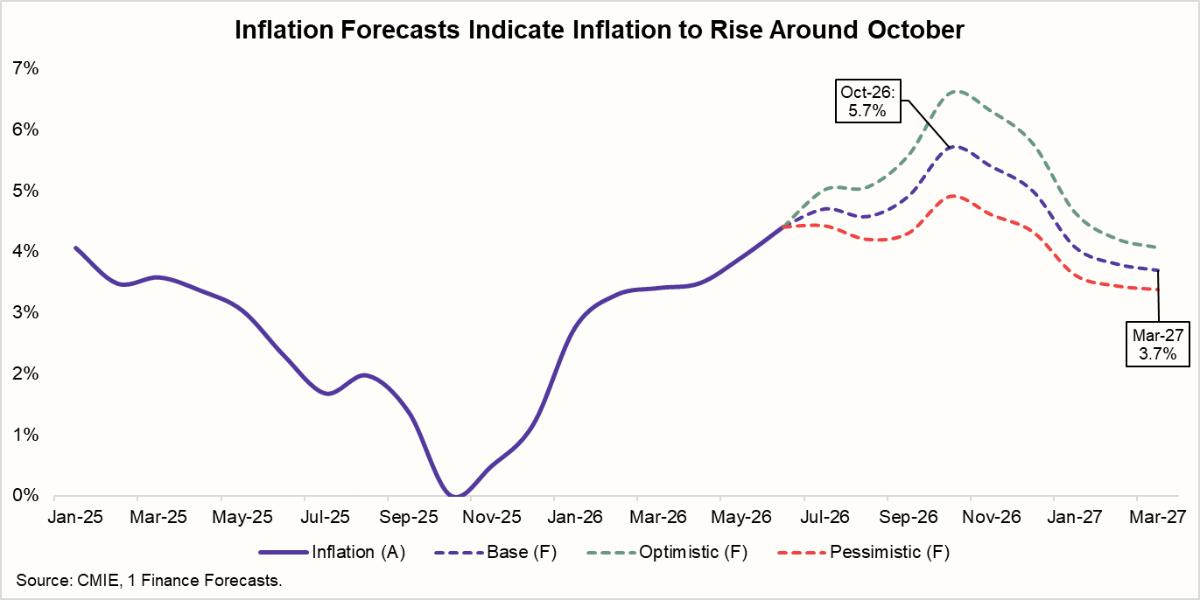
What we got wrong was the reasoning, not the recommendation. Our January call to stay in short and medium duration debt was correct, and we argued it on diverging rate paths. Those paths did not diverge. They converged, on hold, with risk tilted the other way.
We Underrated The Monsoon, And It Cost Us
This is the clearest miss on the board. We rated climate risk Low and wrote that local monsoon dynamics matter more to India than global climate policy. The framing was right. The rating was not, and the reason is worth stating. We filed a slow-moving, near-certain risk under low probability, and a risk rated Low receives no monitoring attention.
June rainfall came in around 40% below normal, the fifth-driest June since records began in 1901. Across June and July, India received 13% below-normal rainfall, with Punjab at a 38% deficit, Haryana at 31% and Uttar Pradesh at 28%. By mid-July, 397 of India's 741 districts had recorded below-normal rainfall, and kharif sowing fell behind across oilseeds, pulses, cotton and coarse grains.
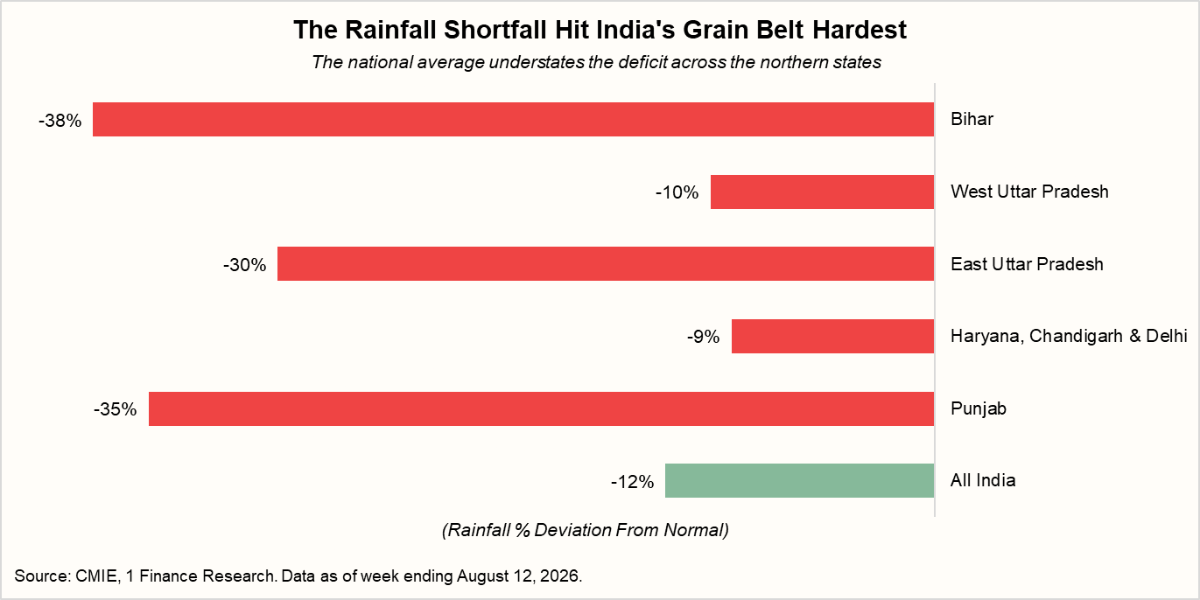
The RBI's July assessment named the weak monsoon alongside the Iran conflict as the two active risks to its outlook. IMD's August forecast at 97% of the long-period average offers some recovery, but rainfall arriving after the sowing window closes has already closed on the affected acreage.
The Risks We Are Watching Without Acting On
Not everything that moved deserves portfolio action. These six sit on the watch list because each has a clear India transmission path that is either not yet open or too slow to reach portfolios within six months. Two of them cut against positions this publication has held approvingly, which is reason to watch them more closely rather than less.
| Risk Event | Our August view | Probability |
|---|---|---|
| Chinese Overcapacity And Import Diversion | New, and the counterweight to a China plus one story. India imported $113 billion from China across all of FY25, for a record $99 billion deficit. The first half of 2026 alone brought $79.41 billion, with the June deficit at $15.3 billion. Two forces drive it: Chinese overcapacity and domestic deflation pushing volume outward, and tariff walls elsewhere redirecting that volume here. It lands on steel, chemicals, solar and EV components, which is also where India's manufacturing capex is going. Transmission runs through margins in those sectors and through the current account. | 🟠 Medium |
| Employment Quality And The Demographic Dividend | Headline unemployment looks stable at 5.4%, but composition is deteriorating. Youth unemployment rose to 15.9% from 14.6% and participation fell to 54.6% from 55.5%. A stable rate alongside falling participation means people are leaving the labour force rather than finding work. Female participation is 33.2% against 77% for men. Retail credit is growing at 16.6% while the income base underneath it is not, and India's dependency ratio window closes around 2045 regardless of what happens in the next six months. | 🟡 Low |
| Central Bank Independence | Where our January US debt sustainability concern now lives. A Justice Department investigation into the outgoing Fed chair, a Supreme Court case over the removal of a sitting governor, and public discussion of reopening the 1951 Treasury and Fed accord. Low probability of a disorderly outcome, high consequence if one occurs. Transmission to India runs through the US long end, the dollar and gold. | 🟡 Low |
| US Midterm Policy Shocks | Volatility typically rises ahead of midterms, but election outcomes rarely change market direction. The more relevant channel is AI regulation entering the political debate, which reaches Indian IT indirectly. | 🟡 Low |
| Russia And NATO Escalation | Battlefield momentum has shifted, and the war continues to disrupt refined product markets, but direct transmission to Indian assets runs almost entirely through the energy channel already captured above. | 🟡 Low |
| Global Recession | Growth held up better than we expected. Global equities recovered sharply in the second quarter after a weak first quarter, US growth forecasts were revised up, and labour markets cooled without breaking. A hard landing now requires a policy error rather than momentum. | 🟡 Low |
If they flare, the table below shows where the pressure points sit.
| Risk | Impact on Global Asset Classes | Impact on Indian Asset Classes |
|---|---|---|
| Chinese Overcapacity And Import Diversion | Chinese Export Equities ▲ Global Steel Equities ▼ Global Chemicals ▼ | Indian Metals Sector ▼ Indian Chemicals Sector ▼ Indian Capital Goods ▼ |
| Central Bank Independence | US Government Bonds ▼ USD ▼ Gold (USD) ▲ Global Banks ▼ | Gold (INR) ▲ INR/USD ▼ Indian Government Bonds ▼ |
| Employment Quality And The Demographic Dividend | Limited direct global transmission | Indian Consumer Discretionary ▼ Indian Education & Skilling ▲ |
| US Midterm Policy Shocks | US High-Beta Sectors ▼ USD ▲ Gold (USD) ▲ | Indian Large Cap Equities ▼ FPI Equity Flows ▼ Gold (INR) ▲ |
| Russia And NATO Escalation | Brent Crude (USD) ▲ European Defence Equities ▲ Euro Area Bank Equities ▼ | INR/USD ▼ Gold (INR) ▲ Indian Oil Marketing Companies (OMCs) ▼ |
| Global Recession | US & Euro Area Cyclical Equities ▼ US Government Bonds ▲ Brent Crude (USD) ▼ | Indian IT Sector ▼ Indian Government Bonds ▲ Indian FMCG & Healthcare ▲ |
The Transmission Sequence Did Not Hold
Our January base case was that most 2026 risks would stall at the second stage of transmission, repricing equities without reaching credit, real estate or capital expenditure decisions.
| First impact: Currencies, commodities, and sovereign bond yields respond almost immediately. FX moves reflect shifts in capital flows and relative growth expectations, while commodities absorb geopolitical and supply-side shocks. |
| Second impact: Equity markets begin to reprice selectively. Earnings expectations adjust, valuation gaps widen, and sectoral leadership changes. This is where most of the return dispersion happens. |
| Third impact: Only if risks persist do they begin to affect credit spreads, real estate activity, and capital expenditure decisions. |
Broadly, they did. The Iran shock hit the rupee and oil immediately and repriced equities through the first quarter, but it went no further.
What we did not anticipate was why. We assumed the strain would show up where India is most exposed to the rest of the world, in the rupee, in foreign exchange reserves and in foreign portfolio flows, and that this is where the sequence would break. It did not. Foreign investors sold Indian equities at a record pace and Indian institutions bought more than they sold.
What stopped the shock was a domestic flow, not an external buffer. We did not forecast that, and a mechanism tested only on the upside of a savings boom is a cushion rather than a floor.
Six Months Later
In January we asked what could go wrong in 2026. The more useful question now is which risks have become connected, and where a shock travels once it lands.
That is the pattern of this half-year. Russian crude is not an energy story or a trade story, it is both, and the cost of resolving one side is paid on the other. Technology decoupling and Chinese import diversion reach the same Indian sectors from opposite directions. A failed monsoon reaches the RBI, which reaches bond yields, which reaches everything priced off them. A list of ten independent risks was the wrong shape for the year we have had, and the update has been rebuilt around that.
The second lesson is about our own filing system rather than about the world. The largest miss on this board was not a risk we failed to see. It was one we saw, described accurately, and rated Low because it moves slowly. Slow and unlikely are different things, and a risk rated Low receives no attention until it arrives.
None of which is an argument for pessimism. India carries real buffers; its domestic institutions absorbed a shock this year that would have moved this market a decade ago, and the growth picture has improved rather than deteriorated. The purpose of a risk radar is not to predict the next crisis. It is to know where uncertainty enters a portfolio, how it travels, and whether that portfolio is diversified enough to absorb it.
We will grade this board the same way in January, and we expect to be wrong about something again.