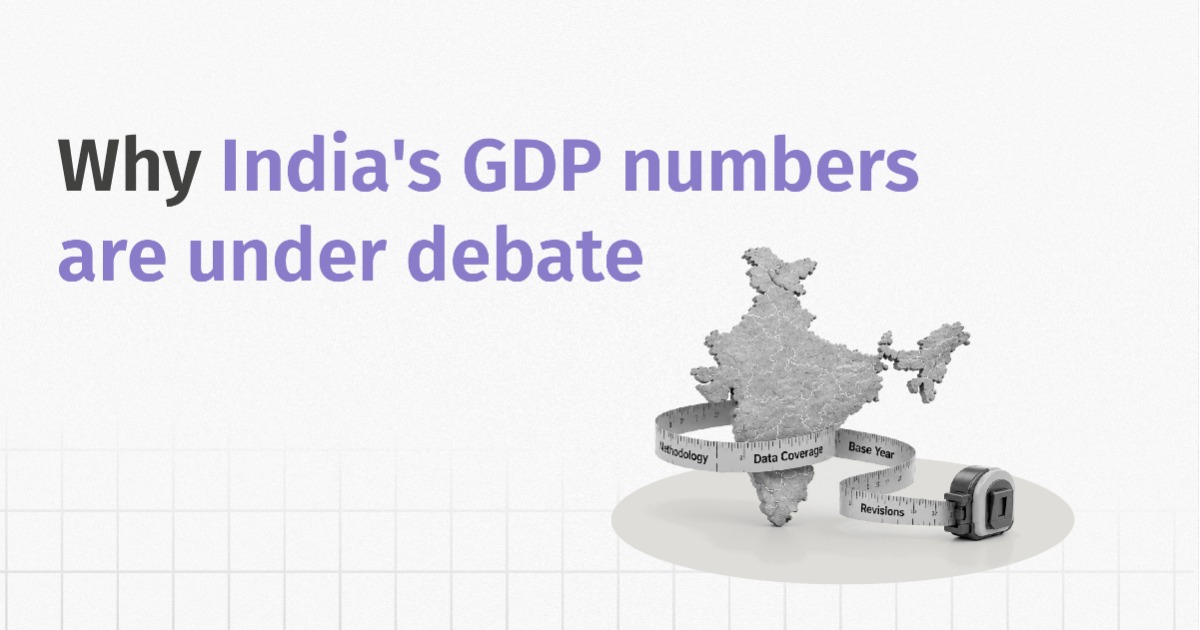
India’s economy grew 7.8% in real terms in Q1 FY27, while nominal GDP grew 10.3%. Real GVA grew 8.2%, and nominal GVA grew 11.5%. Those are the headline numbers. The more important story is what sits underneath them. India has changed the statistical framework used to measure national income.
In February 2026, the GDP base year moved from 2011–12 to 2022–23. The new series also incorporated updated data sources, revised estimation procedures, improved coverage and more granular price measurement. MoSPI subsequently updated the series in August using the new 2022–23-base Output Producer Price Index, Banking Services Price Index and updated administrative data.
The result is a new measuring framework.
What Actually Changed in India's GDP Calculation
Changing the base year does more than update the prices used in GDP calculations. It changes the reference prices used to calculate real growth and can also introduce new data sources and estimation methods.
- The base year itself
GDP at constant prices is now measured using 2022–23 prices rather than 2011–12 prices. MoSPI selected FY2022–23 as the base year because it was a recent normal post-COVID year with robust and comprehensive data across sectors.
- Better information on the informal economy
The new series uses newer information on the unincorporated sector, including the Annual Survey of Unincorporated Sector Enterprises and PLFS data. The objective is to better measure an important part of the economy that corporate and administrative datasets do not capture in the same way as the formal sector.
- More granular deflation
MoSPI has introduced double deflation for agriculture and manufacturing. Instead of applying one price measure to both output and intermediate consumption, it deflates the two separately and derives real GVA from the difference between real output and real intermediate consumption. This matters because input prices can rise faster than output prices, producing a negative implicit GVA deflator even when output prices themselves have not fallen.
| What Changed In GDP Measurement | |||
|---|---|---|---|
| What changed | Old approach, 2011-12 series | New approach, 2022-23 series | Why it matters |
| Reference prices | 2011-12 prices | 2022-23 prices | Resets the weighting of goods and services to reflect a more current economy, including digital and platform-based activity barely present in 2011-12 |
| Informal sector estimation | Extrapolated from a 2011-12 benchmark using formal-sector proxies | Estimated annually using ASUSE and PLFS survey data | Removes a source of drift that had built up over more than a decade without a direct informal-sector survey |
| Deflation method | Single deflation, usually WPI, applied to both output and input | Double deflation for agriculture and manufacturing, with output and input prices deflated separately using relevant price indices | Can produce a negative implicit deflator in a sector even when both output and input prices are rising, if input prices rise faster |
| Benchmarking method | Pro-rata benchmarking for quarterly estimates | Proportional Denton benchmarking | Changes how quarterly estimates are smoothed against annual totals |
| PFCE estimation | Extrapolation-heavy, older CPI classification | Mixed approach using Household Consumption Expenditure Survey, production data and commodity flow, COICOP 2018 classification | More granular, survey-anchored private consumption estimate |
Recommended for you
Readers also explored
India’s Unemployment Rate in 2025
 7 min read

Currency in Circulation: How Much Money Exists in the World?
9 min read
How Much Did the Revision Move Reported GDP Levels?
The new GDP series puts the measured size of the economy below the old series in every comparable year from FY23 to FY26. The gap ranges from 2.65% in FY23 to 3.84% in FY25, before narrowing slightly to 3.30% in FY26.
| GDP Levels Under The Old And New Series | ||||
|---|---|---|---|---|
| Fiscal year | Old series: 2011–12 base | New series: 2022–23 base | Difference | Change |
| FY23 | ₹268.90 lakh crore | ₹261.77 lakh crore | −₹7.13 lakh crore | −2.65% |
| FY24 | ₹301.23 lakh crore | ₹290.73 lakh crore | −₹10.50 lakh crore | −3.48% |
| FY25 | ₹330.68 lakh crore | ₹317.99 lakh crore | −₹12.70 lakh crore | −3.84% |
| FY26 | ₹357.14 lakh crore | ₹345.37 lakh crore | −₹11.77 lakh crore | −3.30% |
The FY25 revision is the largest, at ₹12.70 lakh crore, or 3.84% of the old-series GDP. FY26 follows with a ₹11.77 lakh crore downward revision, equivalent to 3.30%.
These revisions do not represent output disappearing from the economy. They reflect a change in the measured nominal GDP level as the same economic activity is re-estimated under the 2022–23-base statistical framework, using updated data sources, weights and estimation methods. A lower measured GDP level should therefore not be interpreted as a contraction in economic activity.
Which Sectors The Revision Reshuffled
The restatement was not spread evenly. Five sectors were revised up and three down, and the movement underneath is much larger than the headline. About ₹21.23 lakh crore was taken off three sectors and ₹11.70 lakh crore added to five others, leaving a net reduction of ₹9.53 lakh crore, or 2.9% of total GVA.
One sector dominates. Trade, hotels, transport and communication was revised down by ₹11.50 lakh crore, more than the entire net cut to total GVA. Public administration and other services took the second-largest cut, at ₹8.06 lakh crore. Financial, real estate and professional services moved the other way, up ₹6.80 lakh crore, the largest single increase. Manufacturing barely moved, up ₹1.16 lakh crore or 2.5%.
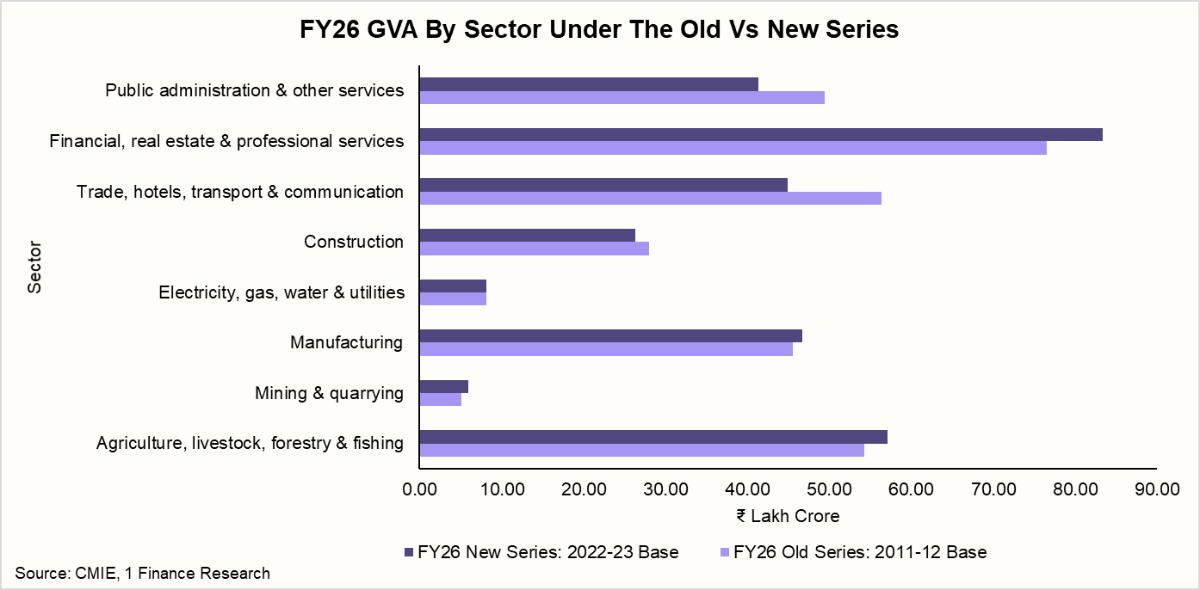
A ₹11.50 lakh crore reduction in trade does not mean trade activity fell by that amount. It means the new series measures trade GVA for FY26 at a lower level than the old series did for the same year, because of better data on small unregistered firms, reclassification between categories and new weights.
The Expenditure Revision Was Concentrated In Private Consumption
The expenditure side shows that the revision was not evenly distributed across demand components. PFCE was revised down by more than the net GDP reduction in every year from FY23 to FY26. The gap was partly offset by upward revisions to GFCE and GFCF.
| Revision By Expenditure Component | |||||
|---|---|---|---|---|---|
| ₹ Lakh Crore | FY23 | FY24 | FY25 | FY26 | FY23–FY26 Cumulative |
| PFCE revision | −15.89 | −17.15 | −22.20 | −23.46 | −78.70 |
| GFCE revision | +1.76 | +0.17 | +1.42 | +2.39 | +5.74 |
| GFCF revision | +0.57 | +0.81 | +1.79 | +2.21 | +5.38 |
| GDP revision | −7.13 | −10.50 | −12.70 | −11.77 | −42.10 |
| PFCE revision (%) | −9.61% | −9.46% | −10.94% | −10.68% | −10.23% |
| GDP revision (%) | −2.65% | −3.48% | −3.84% | −3.30% | −3.35% |
Source: CMIE, 1 Finance Research
The expenditure-side revision was highly concentrated in private consumption. PFCE was revised down by more than the overall GDP reduction in every year, with the cumulative PFCE revision reaching ₹78.70 lakh crore, versus ₹42.10 lakh crore for GDP. In contrast, GFCF and GFCE were revised upward by ₹5.38 lakh crore and ₹5.74 lakh crore, respectively.
The cumulative PFCE level was 10.23% lower under the new series, compared with a 3.35% reduction in GDP. This indicates that the revision was driven disproportionately by changes in the measurement of household consumption rather than a uniform downward adjustment across demand components.The revised series does not mean households actually spent less; it reflects changes in how consumption is estimated.
Why Q1 FY26 GDP Was Revised Four Times
The most contested number in the Q1 FY27 release is not this quarter's GDP. It is the figure this quarter is measured against. Q1 FY26 nominal GDP has been published four times since August 2025.
| Changes In Q1 FY26 GDP Estimates | ||||
|---|---|---|---|---|
| Release | Date | Base year | Q1 FY26 nominal GDP | Change |
| Initial estimate | 29 August 2025 | 2011–12 | ₹86.05 lakh crore | — |
| New series launch | 27 February 2026 | 2022–23 | ₹80.32 lakh crore | −₹5.73 lakh crore |
| Provisional estimates | 5 June 2026 | 2022–23 | ₹80.44 lakh crore | +₹0.12 lakh crore |
| Latest estimate | 31 August 2026 | 2022–23 | ₹80.00 lakh crore | −₹0.44 lakh crore |
As of 31 August 2026, there is no revised estimate for Q1 FY27. The latest estimate puts nominal GDP at ₹88.27 lakh crore, with 10.3% year-on-year growth.
Of the ₹6.05 lakh crore difference between the first and latest Q1 FY26 estimates, ₹5.73 lakh crore (94.7%) came with the switch to the 2022–23 series. The two subsequent revisions together changed the estimate by only ₹0.32 lakh crore.
This was therefore one major methodological break followed by smaller data revisions, rather than four comparable downward revisions. The June 2026 estimate was actually slightly higher than the February estimate. MoSPI attributes the revisions to the base-year change, improved data sources and methodologies, and updated indicators.
The 31 August release reports Q1 FY27 nominal GDP at ₹88.27 lakh crore against the latest revised Q1 FY26 estimate of ₹80.00 lakh crore, both under the 2022–23 series. However, ₹80.00 lakh crore was itself a revision made in the 31 August release after updated IIP and PPI data became available. When Q1 FY27 was benchmarked, the earlier comparable Q1 FY26 estimate was ₹80.32 lakh crore. MoSPI therefore identifies ₹80.32 lakh crore, rather than the old ₹86.05 lakh crore figure, as the relevant benchmark for the Q1 FY27 growth calculation.
Why the Deflator Came In at 2.5%
The Q1 FY27 GDP numbers show a clear difference between nominal and real growth. Nominal GDP grew by 10.3%, while real GDP grew by 7.8%. MoSPI puts the implied GDP inflation rate at 2.5%. The GDP Implicit Price Deflator (IPD) is an economy-wide measure derived from the relationship between GDP at current prices and GDP at constant prices. It captures the combined price effect across the goods and services included in GDP rather than tracking a fixed basket of prices.
| GDP Growth And The Implied Deflator | ||||
|---|---|---|---|---|
| Quarter | GDP series | Nominal GDP growth | Real GDP growth | GDP deflator inflation |
| Q1 FY25 | 2011–12 base | 9.7% | 6.7% | 2.8%* |
| Q1 FY26 | 2011–12 base | 8.8% | 7.8% | 1.4%* |
| Q1 FY26 | 2022–23 base | 8.1% | 6.9% | 2.3%* |
| Q1 FY27 | 2022–23 base | 10.3% | 7.8% | 2.5% |
Source: MoSPI, PIB, 1 Finance Research
The change in Q1 FY26 is particularly important. Under the old 2011–12 series, Q1 FY26 nominal GDP was ₹86.05 lakh crore and real GDP was ₹47.89 lakh crore. Under the revised 2022–23 series, the corresponding figures are ₹80.00 lakh crore and ₹75.46 lakh crore. MoSPI says the change reflects the new base year, improved data sources and methodology, updated coverage, and incorporation of the new IIP and PPI series. The old ₹86.05 lakh crore figure should therefore not be compared directly with Q1 FY27's ₹88.27 lakh crore.
How Does This Compare With Consumer And Wholesale Inflation?
The GDP deflator is different from the Consumer Price Index (CPI) and Wholesale Price Index (WPI) because each measure covers a different part of the economy. The GDP deflator captures price changes across goods and services included in GDP, while CPI focuses on household consumption and WPI primarily measures wholesale prices of goods.
The latest available monthly data provide useful context. In August 2026, CPI inflation was 4.82%, while WPI inflation was 9.92%. Both figures are provisional.
| Inflation Indicators August 2026 | |
|---|---|
| Price Indicator | Inflation (%) |
| CPI inflation | 4.82% |
| WPI inflation | 9.92% |
The gap between these measures and the 2.5% Q1 FY27 GDP deflator does not represent an inconsistency. CPI has a household-consumption focus, while WPI is concentrated on wholesale goods. The GDP deflator has a much broader coverage and reflects the relative price movements of the components that make up GDP. MoSPI specifically notes that more than 300 individual price deflators are used at the item or item-group level in compiling the national accounts, with the aggregate GDP deflator emerging from their combined effect.
Why Can The GDP Deflator Differ So Much From Other Inflation Measures?
Two things explain most of the gap.
- Manufacturing: Nominal GVA grew 7.7%, while real GVA grew 9.2%, resulting in a −1.5% GVA deflator. Under double deflation, output and inputs are deflated separately. Manufactured-product PPI rose 10.7%, while crude petroleum and natural gas PPI rose 58.0%.
- Mining: Nominal GVA rose 22.3%, while real GVA fell 2.4%. Mining and quarrying PPI rose 19.5%, while mining IIP moved from −3.8% in April to −1.4% in May and +1.6% in June, showing how prices and volumes can move in opposite directions.
What the New Series Still Doesn't Tell Us
The new series improves the information set, but there is still an important comparability gap.
The official 2022–23-base series currently provides comparable estimates from FY2022–23 onward. A full back-series would recalculate earlier years under the new methodology so that analysts can construct a consistent longer historical series. MoSPI says the back-series is expected by December 2026.
Until that is published, a long-run growth chart that mechanically joins the 2011–12-base series to the 2022–23-base series contains a methodological break. The break should be clearly marked rather than treated as an ordinary observation.
The same principle applies to the deflator. The 2.5% headline is an implied economy-wide measure. The more useful test for analysts is the underlying item-level price and volume construction, especially where double deflation creates large differences between nominal and real GVA.
What Should Investors And Advisors Take From This?
- Use one series at a time. Do not splice the old and new bases into a single growth narrative. Until the back-series is released, mark the break explicitly.
- Separate levels from growth. A lower GDP level after rebasing does not mean output fell. Sectoral level changes are measurement revisions unless the underlying growth data also show a contraction.
- Treat the deflator as an analytical variable. CPI and WPI provide useful context but are not substitutes for the GDP deflator. The relevant question is how the underlying price and volume estimates are constructed.
- Look beyond the headline. Q1 FY27 should be read through consumption, investment, sectoral GVA, nominal value creation and the persistence of the same patterns in subsequent quarters.
- Watch the next quarter. The Q2 FY27 release will help show whether the Q1 pattern in nominal growth, real growth and sectoral price effects persists or changes. A single quarter is a data point; a sequence of quarters is a trend.
Conclusion
The number is useful, but the framework matters. India's 7.8% Q1 FY27 real GDP growth should neither be celebrated as unquestionable proof of broad-based strength nor dismissed as a statistical illusion. The official estimate is the product of a substantially revised national-accounts framework, and it should be interpreted on its own terms.
The February 2026 rebasing changed the reference year and the data architecture behind GDP. It lowered the measured nominal GDP level for FY23–FY25, reshuffled the sectoral composition and changed reported growth rates in several sectors. The Q1 FY26 benchmark then moved through successive revisions as new data and indicators were incorporated. Finally, double deflation created a technically valid possibility of negative manufacturing GVA deflators when input prices rise faster than output prices.
The strongest analytical conclusion is therefore about comparability and transparency. The new series is more information-rich and methodologically different from the old series. That makes same-series comparisons more important, not less.