The first half of 2026 has unsettled the market’s old hierarchy. South Korea and Taiwan have surged ahead, while China and India have lagged global peers. Gold’s momentum has been uneven, bonds have regained appeal as yields rise, and geopolitical tensions and slowing growth continue to reshape investor expectations.
In this edition, we look beyond headline annual returns to examine the full 2019–2026 investment cycle. By studying multi-year performance, correlations and underlying drivers, we explore India’s divergence, gold’s evolving role and why diversification may matter most when market leadership changes.
| Key Takeaways |
|---|
| Silver (+28% CAGR) and Gold (+25% CAGR) emerged as the best-performing asset classes over the 2019–2026 cycle. |
| 2026 saw leadership rotate towards global equities, with Emerging Markets (+26% YTD) and Developed Markets (+17% YTD) outperforming Silver (+12%) and Gold (+8%). |
| Gold rallied most strongly during COVID-19 (+21%), while subsequent crises produced smaller gains as higher real yields offset safe-haven demand. |
| The NIFTY 500 returned 15% annually over seven years, while its correlation with developed markets has fallen from 90% to 14.9% after Sep-24, marking India as an increasingly standalone source of portfolio diversification. |
| REITs recovered from a 25% COVID drawdown and gained 8% during the Russia–Ukraine war and 4.4% during the Hormuz crisis, demonstrating resilience through market stress. |
| A 20% global sleeve (10% DM, 10% EM) lifts INR annualised returns from 15.0% to 15.9% while moderating stress-period drawdowns, all without added portfolio complexity. |
Comparing Asset Class Performance Across Cycles
Asset class leadership rarely holds for long. Different phases of the economic and market cycle reward different segments. This cyclicality is precisely what the below asset performance quilt captures, mapping the shifting hierarchy of returns across major asset classes over time.
The quilt below tracks the performance of key domestic and global asset categories, including large-, mid-, and small-cap equities, gold and silver, fixed income, international equities across Developed Markets (DMs) and Emerging Markets (EMs), Passive income assets such as REITs & InvITs, and real estate, as measured by the 1 Finance Housing Total Return Index. The chart below compares the annual performance across major asset classes.
| 2019 | 2020 | 2021 | 2022 | 2023 | 2024 | 2025 | 2026 (YTD) | Last 5Y CAGR |
|---|---|---|---|---|---|---|---|---|
BTC 88% | BTC 361% | Smallcap 62% | Gold 13% | BTC 154% | BTC 140% | Silver 122% | EMs 26% | Silver 28% |
DMs 28% | Silver 45% | Midcap 47% | REITs & InvITs 10% | Smallcap 48% | Midcap 26% | Gold 72% | DMs 17% | Gold 25% |
REITs & InvITs 23% | Gold 30% | BTC 45% | Real Estate 10% | Midcap 44% | Smallcap 24% | EMs 37% | Silver 12% | MidCap 17% |
Gold 22% | Smallcap 25% | Lg Cap 25% | Silver 9% | DMs 22% | Silver 25% | DMs 25% | Gold 8% | SmallCap 16% |
Silver 20% | Midcap 24% | DMs 22% | Debt 5% | Lg Cap 20% | DMs 21% | REITs & InvITs 25% | REITs & InvITs 8% | BTC 13% |
EMs 18% | EMs 19% | Real Estate 8% | Cash 5% | Gold 15% | Gold 23% | Real Estate 11% | Real Estate 7% | REITs & InvITs 12% |
Real Estate 12% | DMs 17% | REITs & InvITs 8% | Lg Cap 4% | Silver 11% | REITs & InvITs 16% | Lg Cap 9% | Smallcap 7% | Real Estate 11% |
Lg Cap 10% | Lg Cap 15% | Debt 4% | Midcap 3% | Debt 8% | Real Estate 13% | Debt 8% | Midcap 4% | DMs 10% |
Debt 9% | Real Estate 11% | Cash 3% | Smallcap -4% | EMs 7% | Lg Cap 12% | Cash 6% | Debt 4% | Lg Cap 9% |
Cash 6% | Debt 9% | EMs -3% | DMs -10% | Real Estate 6% | Debt 8% | MidCap -6% | Cash 3% | EMs 7% |
Midcap 0% | Cash 3% | Gold -3% | EMs -14% | Cash 5% | EMs 8% | BTC -2% | Lg Cap -5% | Debt 7% |
Smallcap -8% | REITs & InvITs -7% | Silver -5% | BTC -61% | REITs & InvITs 0% | Cash 7% | SmallCap -6% | BTC -27% | Cash 6% |
Returns for Developed Markets and Emerging Markets converted in INR terms, based on the end-of-period exchange rate
Market Data for YTD returns is considered as of Jul 31, 2026. Gold and Silver price data are also considered as of Jul 31, 2026.5-Year CAGR Data is considered as of Jun-30, 2026. Real Estate Data is considered as of Jun-30, 2026.
| Abbrevation | Asset Class | Index |
|---|---|---|
| Lg Cap | Indian Large Cap Equities | Nifty-100 |
| Midcap | Indian Midcap Equities | Nifty Midcap 150 |
| SmallCap | Indian Smallcap Equities | Nifty Smallcap 250 |
| Real Estate | Indian Residential Real Estate | 1 Finance Housing Total Returns Index |
| REITs & InvITs | Indian REITs & InvITs | Nifty REITs & InvITs Total Return Index |
| Gold | Gold | Average BSE spot prices (INR) |
| Silver | Silver | Average BSE spot prices (INR) |
| BTC | Bitcoin | Bitcoin (INR terms) |
| DMs | Developed Market Equities | MSCI World Index (INR terms) |
| EMs | Emerging Markets Equities | MSCI Emerging Markets Index |
| Debt | Debt | Aditya Birla SL Liquid Fund, ICICI Pru All Seasons Bond Fund and ICICI Pru Short Term Fund. |
| Cash | Cash | Nifty 1D Rate Index |
While each asset class was shaped by a unique set of macroeconomic and market forces, precious metals stand out for delivering exceptional returns over the past 7 years. Understanding what drove gold and silver requires looking beyond geopolitical headlines to the structural forces that have reshaped demand over the past five years.
Gold Doesn't Always Shine When Markets Panic
Gold has long been regarded as the ultimate safe-haven asset. Whenever markets become volatile or geopolitical tensions escalate, investors instinctively expect gold prices to surge. The evidence over the last seven years suggests a more nuanced reality. Gold and Silver lag during the initial phase of market stress, but have gone on to deliver exceptional returns over the years that followed.
The chart below highlights this phenomenon. The three shaded periods represent the global stress events, viz. the COVID-19 pandemic, the Russia-Ukraine War and the recent Strait of Hormuz crisis. Despite experiencing drawdowns during every major stress event, gold prices have risen nearly five-fold over the past seven years, while silver generated even stronger gains.
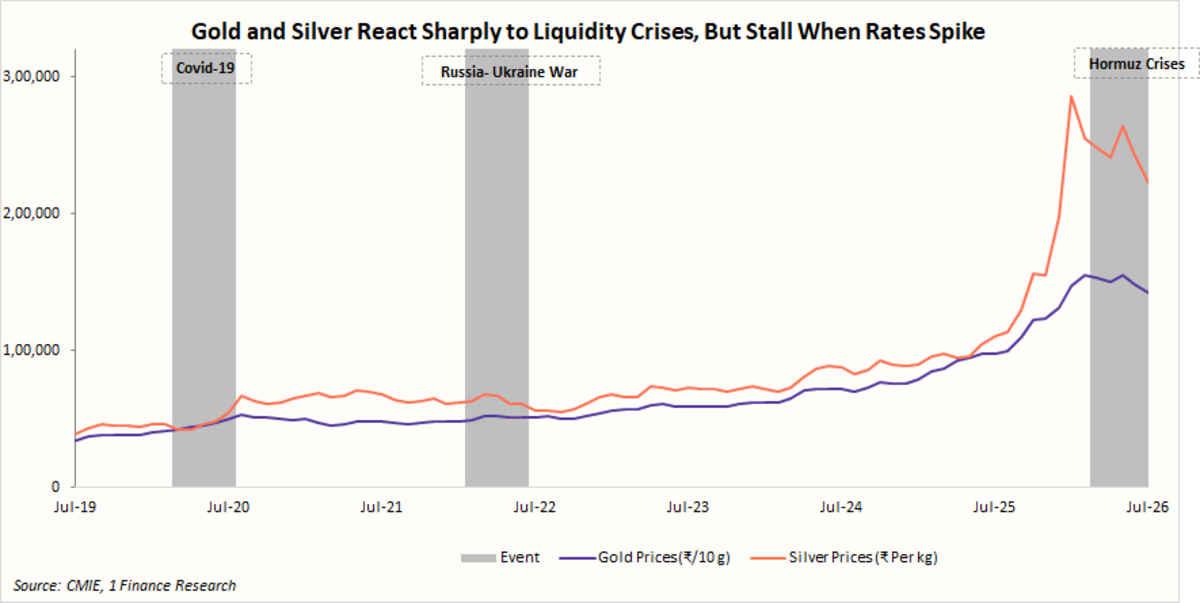
During the COVID-19 panic (Mar-20), gold rose 21%, and silver 18% as investors sought liquidity protection as economic activity fell. Aggressive monetary easing, falling real yields and large fiscal stimulus subsequently strengthened the investment case for precious metals. Gold prices rose consistently because of its monetary and safe-haven characteristics, while fears of a deep industrial recession initially constrained silver’s recovery.
The Russia–Ukraine war (2022) disrupted energy, food and commodity markets, intensifying inflationary pressures and geopolitical uncertainty. Gold rose 8% on high inflation expectations, while silver gained 10% amid the broader commodity rally. However, both metals subsequently experienced drawdowns as markets shifted due to tighter monetary policy, higher yields and reduced liquidity.
The Hormuz episode was a notable exception and generated a more muted response. Gold prices remained flat, as its safe-haven demand was offset by rising-rate pressures. Silver grew only 3%, driven by industrial demand from solar, electronics and electric vehicles. However, tighter monetary conditions and a high base after silver’s strong 2025 rally limited the upside.
The last seven years show that gold's biggest gains have been driven by monetary conditions after crises, rather than the crises themselves, reinforcing its role as a strategic portfolio diversifier rather than a tactical hedge. Both metals have delivered compelling long-term compounding, with gold supported by central bank demand and rising sovereign debt, and silver benefiting from structural industrial demand.
India’s Equity Performance and Divergence with Global Markets
While gold acts as a shock absorber during periods of uncertainty, equities remain the primary long-term growth engine. Their ability to compound capital through earnings growth and economic expansion makes them essential for investors with a long investment horizon. Gold and equities therefore serve complementary roles in a balanced portfolio.
The chart below compares Indian equities (NIFTY-500) with the MSCI World Index, which covers Developed Markets (DMs) and the MSCI Emerging Markets Index (EMs) over the last seven years, with all indices rebased to 100. It shows DM and EM performance in both base currency, USD, and INR terms, highlighting the additional impact of INR depreciation on returns for Indian investors.
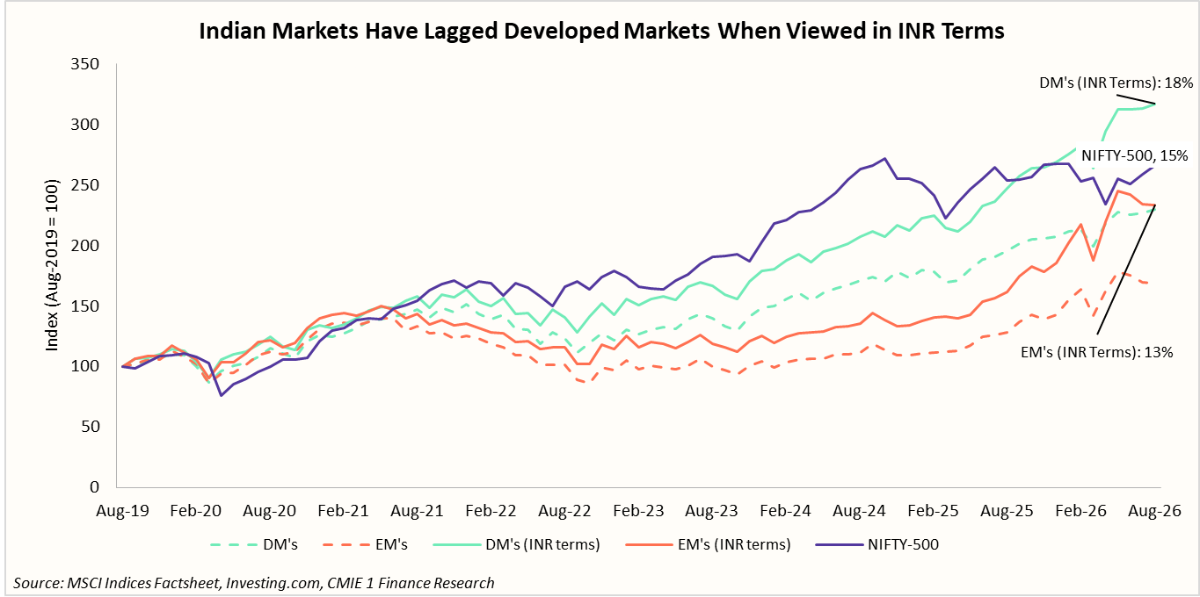
In price terms, DM equities delivered a 13% annualised return over seven years, compared with 8% for EMs and 15% for the NIFTY 500. DM performance benefited from earnings growth and technology leadership, while EMs lagged amid weaker Chinese growth, a strong US dollar and geopolitical risks.
For Indian investors, persistent INR depreciation materially improves the appeal of overseas equities. Once currency effects are included, DM returns rise to 18%, and EM returns to 13%. This currency tailwind strengthens the case for global diversification, even when local market performance appears moderate.
Additionally, a notable decoupling trend has emerged in Indian equities. Over the seven years since Aug-19, NIFTY-500 correlation with DMs stood at 90.1% and with EMs at 39.3%. Post Sep-24, however, these correlations fell sharply to 14.9% and 10.7%, respectively, even as DM and EM correlation rose to 97.3%. This growing domestic orientation suggests that India is increasingly emerging as a distinct source of growth and diversification within global portfolios.
REITs as Portfolio Diversifiers During Market Stress
REITs have emerged as a popular investment vehicle for commercial real estate exposure without the capital intensity or illiquidity of direct ownership. Their income and diversification benefits appeal to investors seeking stability. The chart below tracks NIFTY REITs and InvITs Index performance through COVID-19, the Russia-Ukraine war and the Hormuz crisis.
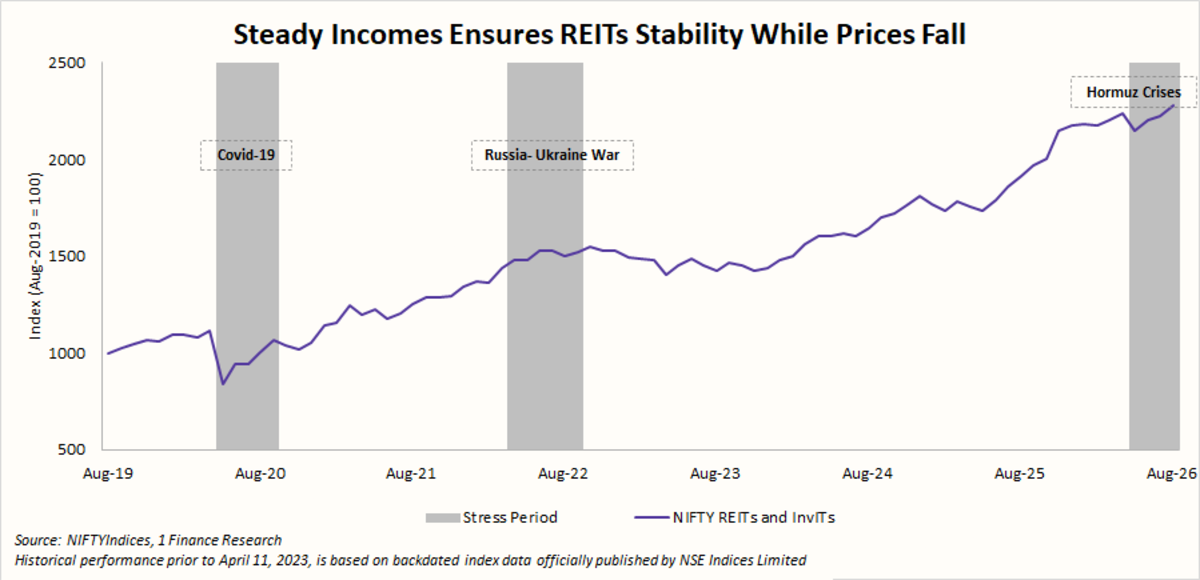
Historical data indicate that REITs remained strong across the stress periods considered above. COVID-19 triggered a 25% drawdown, but the index recovered by Nov-20. During the Russia-Ukraine war, REITs gained 8% despite a contained 1.8% drawdown. As the index was launched in April 2023 but carries a July 2019 base date, the earlier observations represent historical index series data.
During the Hormuz crisis, REITs gained 4.4%, reflecting gains from recurring rental income, stable occupancy, and predictable distributions. The measured growth, rather than a sharp safe haven rally, suggests that REITs derive their defensive qualities primarily from cash flow visibility. Overall, the evidence indicates that REITs can cushion portfolio volatility while retaining exposure to long-term real asset growth.
Concluding Remarks
The evidence across asset classes points to a broader investment lesson. Market leadership is shaped by changing growth conditions, liquidity, interest rates, currencies and investor expectations. No single asset class remains dominant across every phase, which makes portfolio construction more important than simply chasing the latest winner.
International equities add another layer of diversification within the broader portfolio. As the chart below indicates, a modest 20% global allocation, split equally between DMs and EMs, lifted annualised INR returns from 15.0% for the NIFTY 500 to 15.9% for the blended portfolio, while moderating drawdowns during Covid 19, the Russia-Ukraine war and the Hormuz crisis.
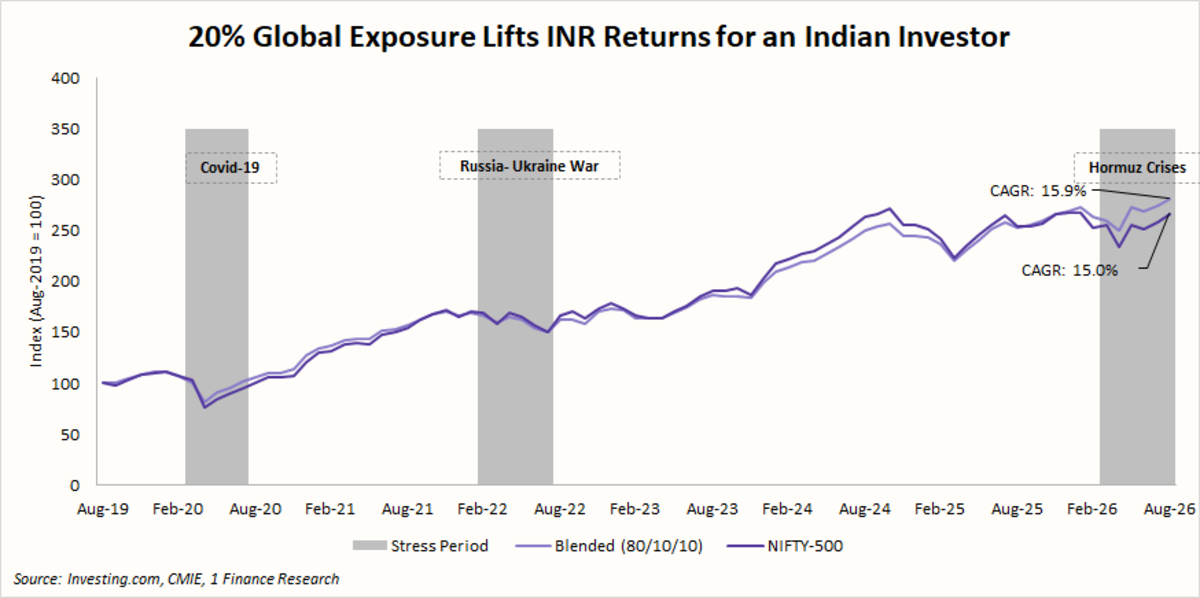
The modest improvement in returns is significant because it comes without materially increasing portfolio complexity. A 10% allocation to DMs provides exposure to technology-led earnings growth, while a 10% allocation to EMs adds cyclical upside and valuation diversity. Together, these help Indian investors capture global tailwinds, cushion stress-period drawdowns and enhance long-term compounding, with INR depreciation providing an additional return advantage.
The central lesson is that stronger portfolios are built not by predicting which asset will lead next, but by owning a thoughtful mix of assets that respond differently to changing conditions. Equities provide long-term growth, gold offers stability, REITs contribute income, and global markets exposure broadens the opportunity set. As leadership shifts across markets and economic regimes evolve, diversification provides the discipline to remain invested, participate in new opportunities and compound wealth through uncertainty.