Three months ago, the thesis was straightforward: the Strait of Hormuz had exposed a supply-chain fault line that many investors were still underestimating. Today, the thesis is more useful and more interesting. The shock is still there, but the metals market is no longer trading as a single basket. Steel, aluminium, copper, gold, and silver are each being driven by different forces, and that is exactly why the opportunity set is better now than it was in March.
The June 15 US-Iran MoU briefly triggered a relief rally across the complex. Then Iran re-declared the Strait of Hormuz closed on June 20, citing violations of the agreement and renewed Israeli strikes in Lebanon. Shipping data now shows a sharp drop in traffic, even though some tankers have still moved through the waterway, which makes the situation better described as disrupted and contested, rather than neatly open or closed. For investors, that nuance matters: the market has to price not just geopolitics, but the timing, persistence, and asymmetry of disruption.
What has emerged over the past four months is a metals tape with five different macro engines. Steel is now a trade-policy story. Aluminium is a logistics proxy. Copper is a tariff-and-electrification story. Gold is consolidating after a large rally. Silver is finally beginning to look like a structural rerating candidate.
Outlook 2026
| Metal | March view | June view | What changed |
|---|---|---|---|
| Steel | - | Cautiously positive | New policy and trade cycle |
| Aluminium | Positive | Positive | Hormuz risk is back |
| Copper | Positive | Positive | Still constructive, but tariff timing now matters |
| Gold | Neutral | Neutral | The floor looks better, but real rates still cap upside |
| Silver | Neutral | Neutral | The structural deficit is clearer now |
Six Months On. What Held and What Changed
In our Global Economic Outlook 2026, published early January, we made one call about metals that stood above everything else: the opportunity lies in the gaps, not in a single view of the asset class.
Six months later, the biggest lesson is that the metals market did not move as one. The Fed stayed hawkish, gold remained supported but volatile, silver stayed fundamentally tight even after a sharp correction, and the Hormuz shock created a new pricing layer for aluminium and copper.
| December 2025 call | What actually happened by June 2026 | Status |
| The Fed would cut rates by about 50 bps, and real yields would ease. | The Fed instead signalled a more hawkish path, and real yields stayed elevated. | Did not hold |
| Gold would stay supported by central-bank buying and macro uncertainty. | Gold rallied sharply, then corrected, but remains supported by structural demand. | Broadly held |
| Silver would outperform in a fifth straight deficit year. | Silver surged, then sold off sharply, but the market is now in a sixth straight deficit year. | Partly held |
| Industrial demand would remain the key silver driver. | That still holds, although solar and substitution trends have made the story more mixed. | Mostly held |
| Metals would not move together, creating dispersion opportunities. | That is exactly what has happened: each metal is now responding to a different driver. | Held |
| Hormuz was not central to the call. | It became a major new variable and changed the aluminium, copper, and logistics backdrop. | New factor |
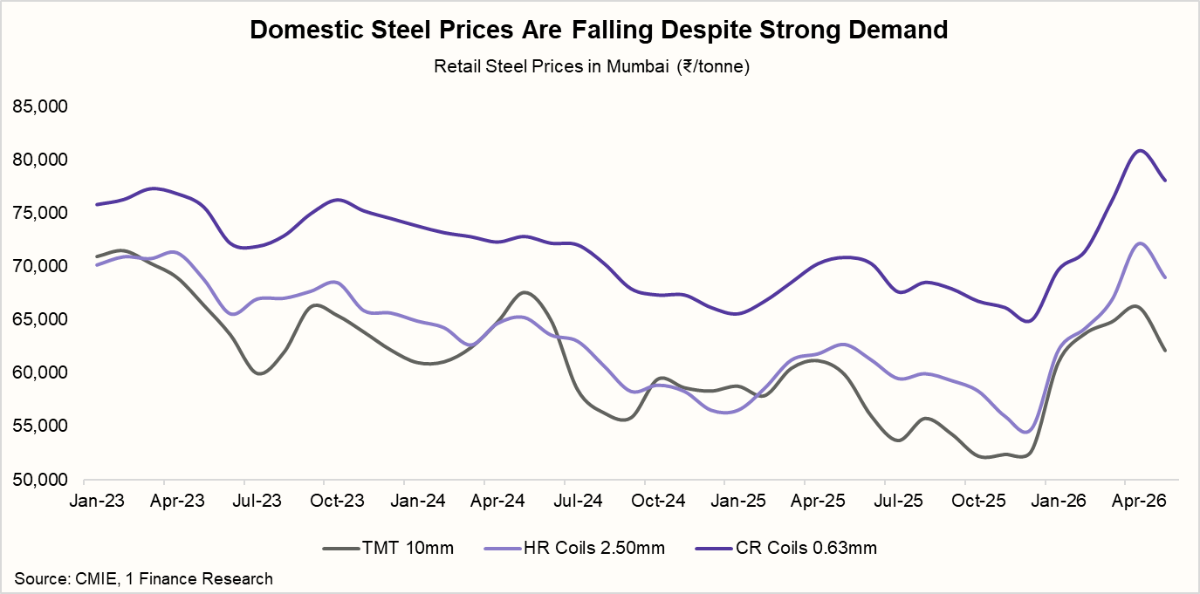
Steel Demand Is Strong. Prices Are Being Imported Away.
Steel demand is still growing, but prices are being set by imports. India consumed 27.36 million tonnes of finished steel in April–May 2026, up 8.7% year-on-year, and crude steel production also rose 2.7%. So the volume story is intact. What is not intact is pricing power.
| Steel Consumption Is Outpacing Production Every Year | |||
|---|---|---|---|
| Indicator | Apr–May 2025-26 | Apr–May 2026-27 | Change |
| Crude steel production | 27.30 MT | 28.04 MT | 2.70% |
| Finished steel production | 25.71 MT | 27.36 MT | 6.40% |
| Finished steel consumption | 25.17 MT | 27.36 MT | 8.70% |
| Finished steel imports | 0.94 MT | 1.37 MT | 45.70% |
| Finished steel exports | 0.77 MT | 0.98 MT | 27.30% |
| Net trade position | -0.17 MT | -0.39 MT | Net importer, gap widening |
A January 2026 safeguard duty of 12%, tapering to 11.5% and 11% over three years, was designed to check the import surge. It has not held. Finished steel imports for April–May 2026 hit 1.37 million tonnes, up 45% year-on-year, with HR coil and strip alone surging 137.8%. The targeted anti-dumping duty of $223–$415 per tonne on electrical steel from China is working (electrical sheet imports fell 20.6%), but the broad safeguard is not offsetting the landed cost advantage Chinese producers hold on high-volume categories.
| Top Imported Steel Products | |||
|---|---|---|---|
| Product | Apr–May 2025-26 (MT) | Apr–May 2026-27 (MT) (P) | Change |
| HR Coil/Strip | 0.23 | 0.56 | 137.80% |
| CR Coil/Sheets | 0.19 | 0.22 | 16.10% |
| GP/GC Sheets/Coil | 0.14 | 0.19 | 38.60% |
| Plates | 0.12 | 0.14 | 10.30% |
| Elect. Sheets | 0.11 | 0.09 | -20.60% |
| Total | 0.94 | 1.37 | 45.00% |
The country mix shows the rerouting risk clearly. China’s share of India’s finished steel imports rose to 31.3% from 22.7% a year earlier, while Vietnam entered the top sources with a 6.3% share. That suggests ASEAN routing is no longer a theoretical concern; it is already visible in the data.
| Share of Major Countries in India's Finished Steel Imports | |||
|---|---|---|---|
| Country | Apr–May 2025 (%) | Apr–May 2026 (%) | Change |
| China | 22.7 | 31.3 | +8.6 pp |
| Korea | 36.8 | 26.4 | -10.4 pp |
| Japan | 13.2 | 19 | +5.8 pp |
| Vietnam | — | 6.3 | New entrant |
| Others | 27.4 | 17 | -10.4 pp |
The consequence is visible in prices. TMT bars in Mumbai fell 5.7% month-on-month in May to Rs. 62,140 per tonne. Hot-rolled coils fell 4.2% to Rs. 68,990 per tonne. Cold-rolled coils fell 2.5% to Rs. 78,120 per tonne. All three moved lower while coking coal held at $239 per tonne, compressing producer margins from both sides. SAIL's saleable steel sales fell 20.5% year-on-year in May.
Until the government extends anti-dumping coverage specifically to HR coil, or coking coal corrects from current levels, domestic producers face continued margin compression through H1 FY27. Capacity expansion at SAIL's Bhilai and JSW's Paradip signals long-run conviction in the demand thesis.
Near-term, the margin picture is difficult: steel prices are falling sharply while input costs are elevated. The safeguard is holding in most categories, but not in HR Coil, the largest single import item. And Vietnam's emergence in the import source mix is the government's clearest signal yet that the ASEAN transhipment channel is live, not hypothetical.
The Crisis Premium in Aluminium Is Back
If steel is a trade-policy story, aluminium is a shipping-and-logistics story. LME aluminium began 2026 near $3,015 per tonne and was already supported by tight inventories, but the Hormuz shock turned that bullish backdrop into a full crisis premium. By early June, the metal had climbed to a four-year high above $3,800 per tonne before the June 15 de-escalation pulled prices back. The June 20 re-closure has since put that premium back into the market, though less violently than in March, as traders have now priced the same risk in and out more than once.
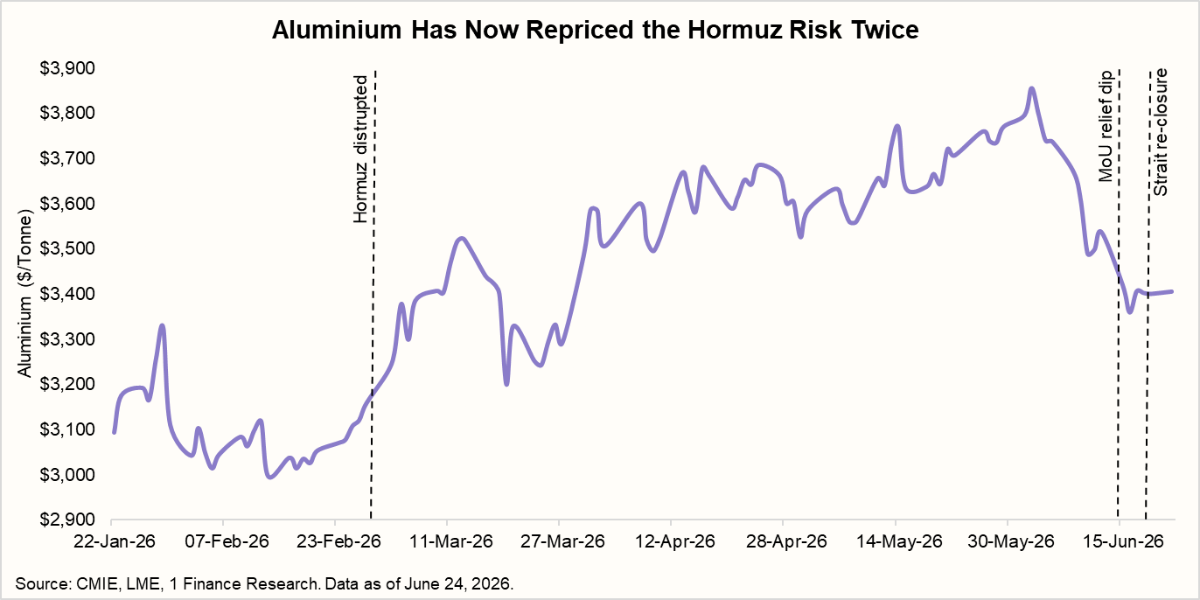
Aluminium is the metal most directly exposed because Gulf supply matters disproportionately to the non-Chinese market. The Gulf states (Qatar, UAE, Bahrain, Saudi Arabia) produced roughly 6.5 million tonnes of primary aluminium in 2025, accounting for about 9% of global supply and 25% of non-Chinese supply. When Iranian missile strikes hit Gulf smelting infrastructure on March 28, capacity equivalent to 1.6 million tonnes per year was suspended. Qatalum shut down. EGA in Abu Dhabi declared force majeure on European contracts and is not expected to return to full capacity before August.
| Smelter (Country) | Annual Aluminium Production (MT) | March 2026 status | June 2026 status | Read-through |
|---|---|---|---|---|
| Qatalum (Qatar) | 0.68 million | Controlled shutdown; later running at about 60% capacity. | Still exposed to gas and shipping risk. | Highly sensitive to Hormuz. |
| Alba (Bahrain) | 1.60 million | 19% capacity cut; force majeure. | Restart underway, but not normalised. | Supply is still constrained. |
| EGA (UAE) | 2.70 million | Export and logistics disruptions. | Still vulnerable to renewed shipping risk. | Key regional supplier, but exposed. |
| Ma'aden (Saudi Arabia) | 0.78 million | Relatively stable. | Still the most insulated of the group. | Best positioned among Gulf smelters. |
Note: MT refers to million tonnes.
What makes the current setup more interesting is that the raw material signal has been calmer than the metal itself. Alumina prices were broadly stable around $307 per tonne in mid-June, even as aluminium remained volatile, suggesting the market is still pricing a temporary dislocation rather than a permanent break in the supply chain. That matters because it limits how far the market can extrapolate the rally unless the disruption lasts long enough to hit inventories more directly.
A durable reopening of Hormuz would likely pull aluminium back toward the low-to-mid $3,000s, while a prolonged disruption would keep the market tight and could push prices back toward the June highs. For Indian investors, the logic is straightforward: upstream producers benefit from elevated LME prices, while downstream users in cables, packaging, autos, and power equipment continue to absorb the cost pressure.
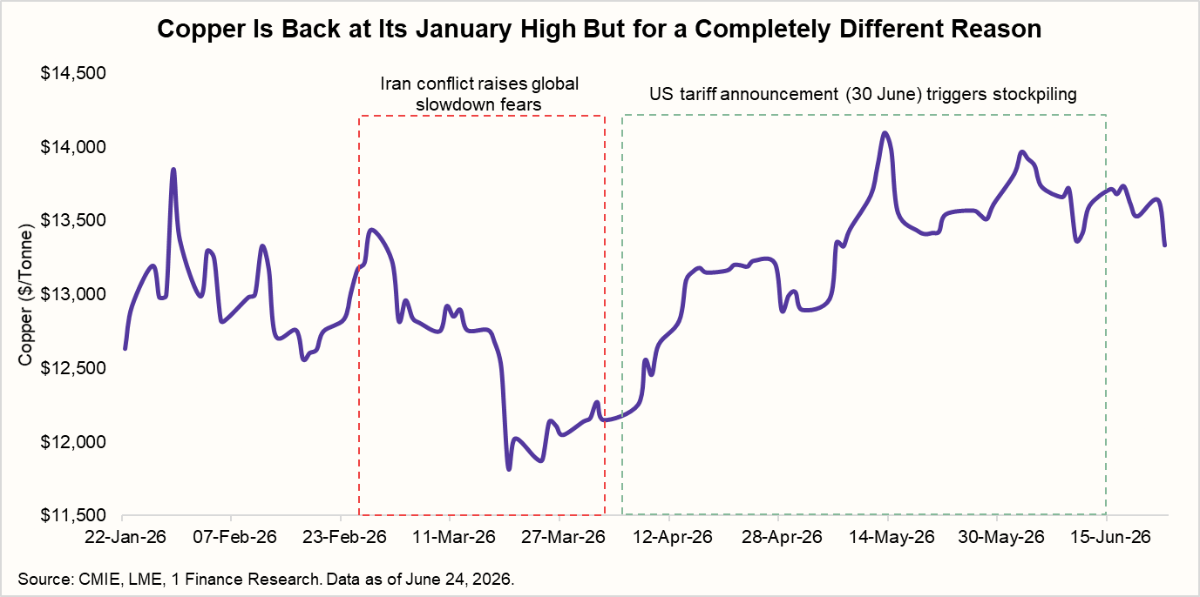
The Copper Thesis Has Shifted. The Destination Has Not Changed.
In March, copper was a Hormuz trade. In June, it is an AI-and-tariff trade. LME copper is back near $13,700 per tonne, close to its January record, but the move is being driven by a very different mechanism this time.
The near-term catalyst is the expected US tariff decision on refined copper imports by June 30, with a tariff of at least 25% now widely anticipated. American buyers have been pulling material forward ahead of that deadline, and that stockpiling is a big part of what has supported prices. Once the tariff is confirmed, that front-loaded demand should fade, which raises the odds of a near-term correction.
The longer-term setup has not changed. Copper remains one of the tightest structural stories in metals. Supply projections still point to an average annual deficit of roughly 491,000 tonnes through 2030, while AI data centres alone are expected to consume about 475,000 tonnes in 2026, up 110,000 tonnes year-on-year. On top of that, new mines take more than a decade to come online, which means supply cannot respond quickly enough to offset demand.
The June 20 re-closure of Hormuz adds a secondary risk channel. The Middle East accounts for a large share of global sulphur supply, and sulphur matters because it is used in copper extraction across Africa and Latin America. If the closure lasts, that can tighten supply further through the cost and availability of sulphuric acid, even though it is not the main driver of the current rally.
For India, the transmission is direct. India imports about 95% of its copper needs, so elevated global prices quickly feed into cables, transformers, and EV-related components. That means downstream manufacturers face margin pressure even if domestic demand stays healthy.
Gold Has Corrected. Silver Is Catching Up.
Gold peaked at $5,589 per ounce in January 2026 and has since corrected about 25% to around $4,177. Silver peaked at $116 and now trades near $74, a decline of roughly 36%. Both metals have pulled back, but the more important question is what has held them up.
For gold, the answer is that the floor is stronger than the macro backdrop would normally imply. Markets have now priced out all Fed rate cuts for 2026, real yields remain elevated, and some traders are even pricing in a hike before year-end. In a normal cycle, that combination would have pushed gold much lower. It has not done so this time.
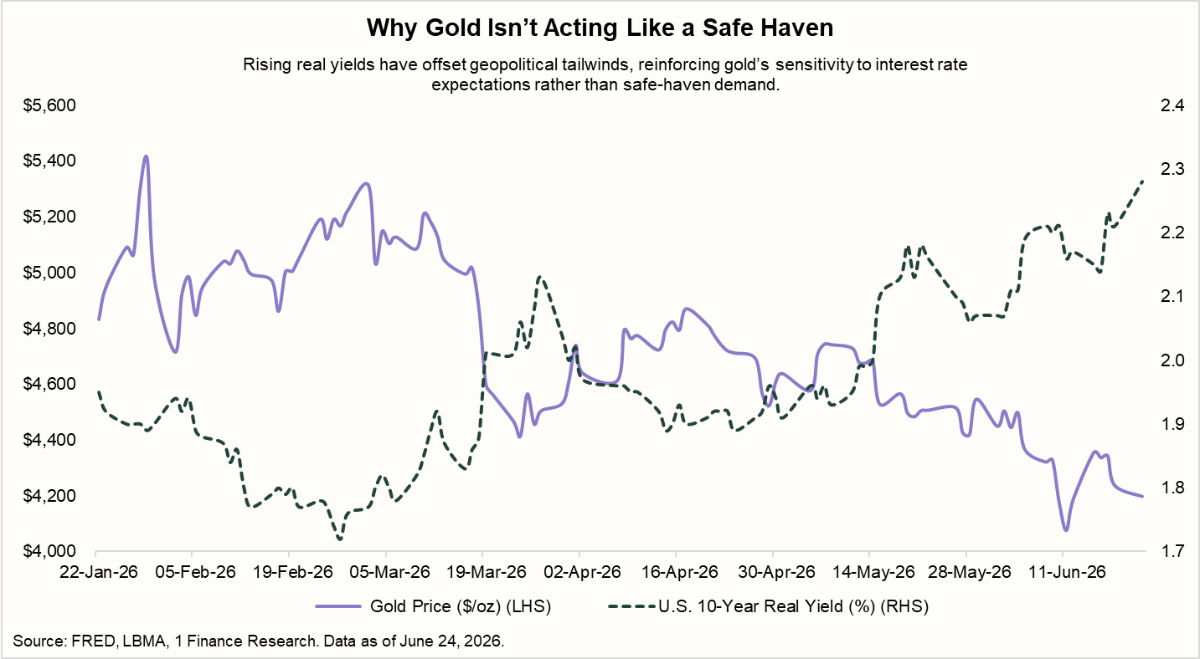
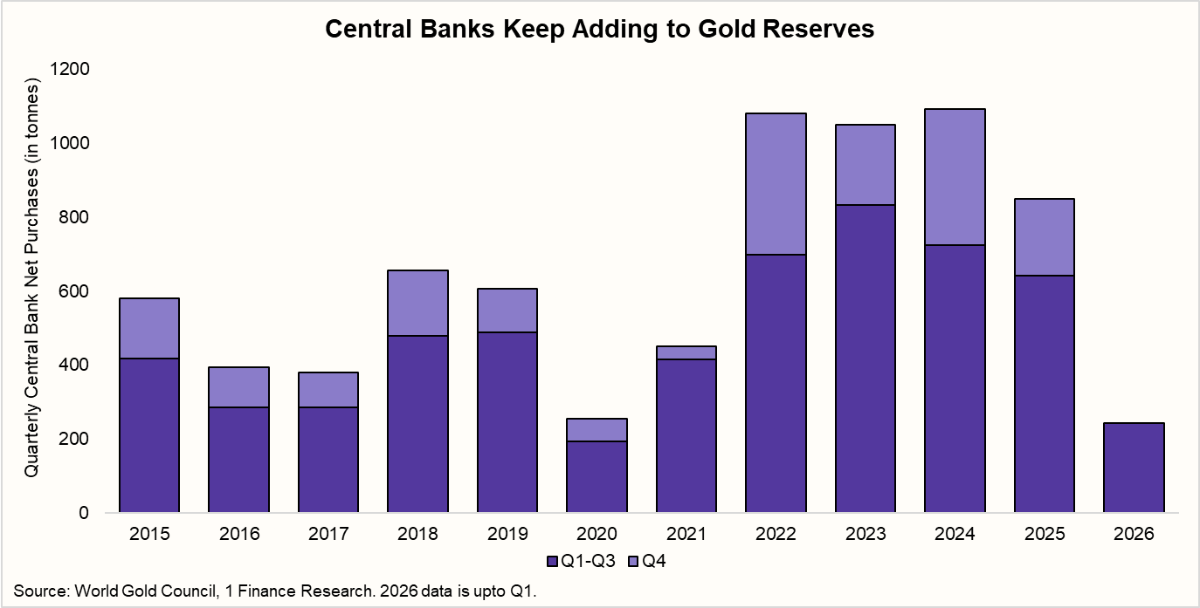
The main reason is central-bank demand. These buyers have continued to accumulate through the correction, and they do not behave like short-term momentum traders. That steady structural bid has changed the nature of gold’s support. The old relationship with real yields still matters, but it no longer explains the full price action on its own.
In India, the picture is different again. The import duty was raised from 6% to 15% in mid-May, which lifted domestic prices even as international prices remained broadly flat. As a result, physical demand has cooled and is likely to stay soft through July before the seasonal pickup in August. That does not mean demand is broken; it means demand is price-sensitive.
Silver fell harder than gold from the January peak, correcting about 36% versus gold’s 25%. But the ratio data since May tells a more nuanced story. The gold-to-silver ratio dropped from 63.4 on May 1 to a low of 53.9 on May 13 and 14, showing that silver was outperforming gold very sharply through that stretch. It then reversed just as fast, rising back to 66.5 by June 23. Silver ran hard, then gave most of it back.
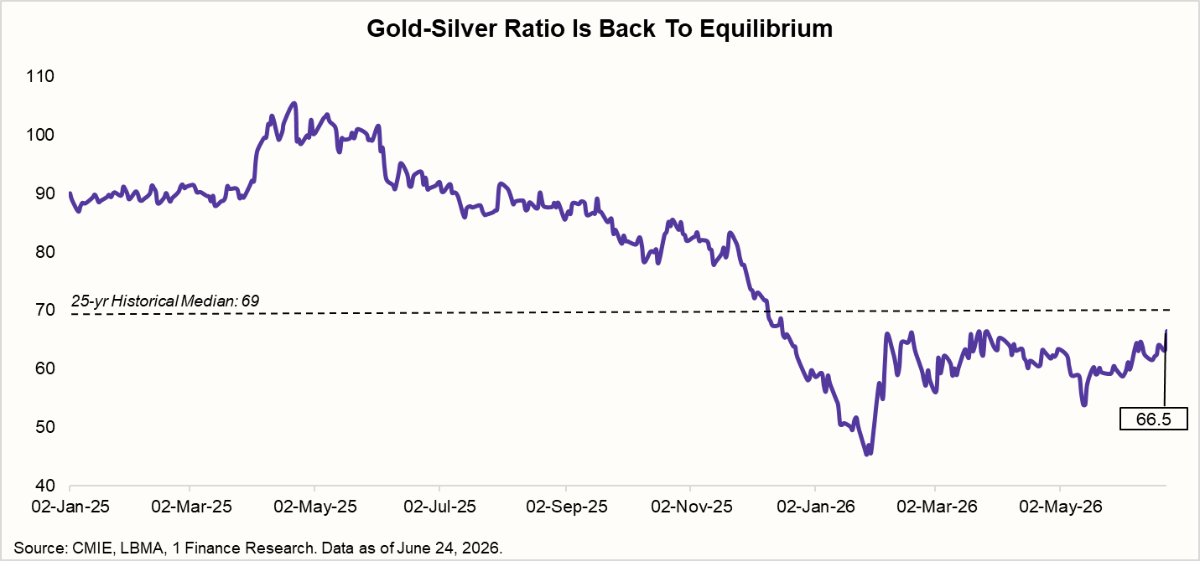
At 66.5, the ratio signals that silver remains cheap relative to gold on a longer-term view. When the ratio has been at these levels historically, silver has tended to outperform gold over the following 12 to 24 months. But the May round trip is a reminder that silver moves in sharp bursts, both up and down.
The structural case rests on six consecutive years of supply deficit. The market balance was -46.3 million ounces in 2026, slightly wider than 2025's -40.3 million ounces. Total supply is actually falling, down 2% in 2026 to 1,066 million ounces, even as recycling grows.
The composition of demand has shifted in a way that matters. Photovoltaics demand is forecast to fall 19% in 2026 to 151 million ounces as manufacturers move toward copper-based cell designs. This is a real and accelerating substitution. But coin and bar demand is growing 18% to 257.6 million ounces, the investment leg picking up what solar is putting down. The deficit persists not because solar demand is holding up but because investor accumulation is replacing it.
The Divergence Is the Opportunity
What began as a Hormuz shock has become something more useful: a metals market where five assets are moving on five different drivers, and where the spread between them is the opportunity. Steel is being pressured by a trade policy that is working in some categories and failing in others. Aluminium is a direct logistics proxy for the Strait and will remain volatile until the situation actually resolves. Copper has re-converged with its January highs through a tariff mechanism that creates a near-term dip before the structural thesis reasserts. Gold is holding a floor that real yield models cannot fully explain, with central bank demand as the structural answer. Silver has the strongest forward-looking case of the five, with six consecutive years of deficit, an investment leg replacing the solar demand that is genuinely fading, and a ratio that historically signals outperformance ahead.
The December outlook called this: the opportunity lies in the gaps, not in a single view of the asset class. Six months of a war, a trade war, a tariff cycle, and a central bank pivot that never came have only made that case stronger.