Every project registered under RERA carries a public ledger of consumer complaints against its developer, covering delayed possession, construction defects and broken commitments. In theory, that ledger is a warning label, and a warning label should depress price returns. It doesn't. Across Mumbai, Thane and Pune, we grouped projects into four complaint bands, from zero complaints to the worst-hit 68-100% band, and measured price CAGR in each. The relationship is flat, noisy, and often backwards; the lightly complained-about band frequently returns less than the heavily complained-about one. The grievance record sits in the public domain, yet it barely registers in buyers' willingness to pay, so it never gets priced into returns.
Delhi NCR tells a separate but reinforcing story. What moves price there is tangible and repeatable, namely execution, on-time delivery and developer health. Noida's PSF has soared as the share of sales from distressed developers collapsed to 4%, while Gurugram's developer delay rate fell from the mid-60s to roughly 12% and prices turned back up. Buyers reward delivery and shun distress. They just don't read the complaint ledger on the way in.
| Key Takeaways |
|---|
| In Mumbai, the complaint-free band leads at 3.3% CAGR, but the lightly-complained 1 to 33% band returns the lowest of all at 1.6%, below the heavily-complained 34 to 67% band at 2.8%. Complaints are not priced in. |
| Western Mumbai suburbs now trade 14% above the East (₹30,818 vs ₹27,076 PSF), with the Western share of sales as high as roughly 69%. Jobs and shorter commutes drive the gap. |
| In Thane, 4 of the 5 top markets sit in Navi Mumbai; Juinagar leads at 42% YoY. In Pune, every complaint band returns within one point (4.3 to 5.1%), the clearest proof that complaints don't price returns. |
| In Gurugram, the delay rate collapsed to roughly 12%, and PSF rose again. The biggest and smallest homes are gaining; 4+ BHK is up 30.6% YoY while 2 to 2.5 BHK fell 19.7%. In Noida, distressed-developer sales fell to 4%, and PSF appreciated across every configuration. |
| In Hyderabad, 7 of the 10 best micromarkets sit in the Northwest, led by Ameerpet at +120% YoY. In Bengaluru, the homes selling fastest are also rising fastest in price; compact homes lead at +18 to 20% YoY. |
Mumbai Shows Complaints and Returns Move Independently
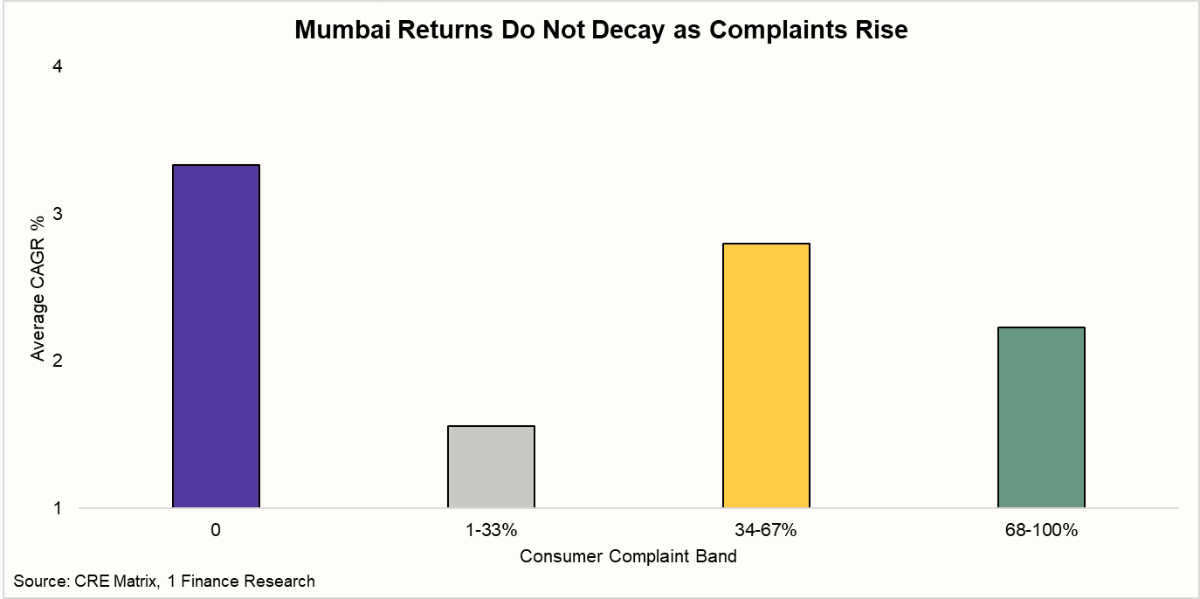
The zero-complaint band does lead, at 3.3% CAGR, but the pattern collapses immediately. The lightly-complained 1 to 33% band delivers the lowest return of all at 1.6%, while the heavily-complained 34 to 67% band rebounds to 2.8%, second only to the cleanest projects. Even the worst-hit 68 to 100% band still returns 2.2%. If complaints were a genuine price signal, that worst band would sit at the bottom. Instead, the entire spread is barely 1.7 points, and the ranking is scrambled. The grievance record simply isn't being discounted.
Prices Follow the Jobs Across Mumbai's Suburbs
Staying within Mumbai, the sharper story is geographic. The Western suburbs are the city's best-performing market and the Eastern suburbs its worst, and the gap between the two is widening on both price and sales volume.
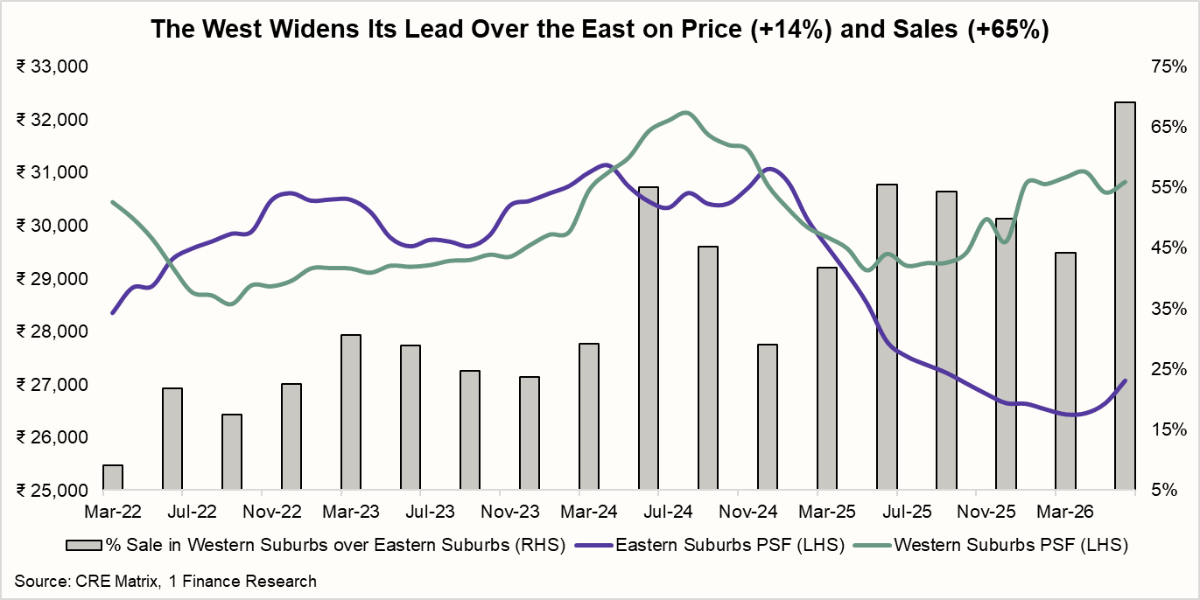
As of June 2026, Western-suburb PSF stands at ₹30,818 against the East's ₹27,076, a 14% premium. Over the past year, Western PSF rose 4.6% while Eastern PSF actually fell 2.6%. The Western share of the two-region sales split has climbed from roughly 9% in March 2022 to roughly 69% by June 2026.
The driver is employment. The bulk of Mumbai's office and commercial jobs sit in the Western corridor, and people increasingly want to live where they work, to cut a punishing commute, reclaim travelling time and stay close to the office. That very human preference has translated into hard money, pushing Western prices up sharply while the East stagnates.
Recommended for you
Readers also explored

Currency in Circulation: How Much Money Exists in the World?
 9 min read

India's IT Sector Outlook for FY2026
8 min read
Three of the five best-performing micromarkets in Mumbai sit in the Western suburbs, and the two exceptions reveal a second force at work.
| Micromarket | Latest PSF | YoY | 3-Year CAGR | Macromarket |
|---|---|---|---|---|
| Kandivali East | ₹42,624 | 28.9% | 9.8% | Western Suburbs |
| Borivali East | ₹29,770 | 22.7% | 1.6% | Western Suburbs |
| Fort | ₹40,991 | 20.1% | 11.6% | South Mumbai |
| Andheri West | ₹41,700 | 16.1% | 1.9% | Western Suburbs |
| Colaba | ₹87,791 | 13.6% | 23.6% | South Mumbai |
Kandivali East (+28.9% YoY), Borivali East (+22.7%) and Andheri West (+16.1%) carry the Western surge. But Fort (+20.1%) and Colaba (+13.6%, at ₹87,791 PSF) show that alongside the job-hub corridors, areas with deep legacy demand keep appreciating too. Prestige pockets with scarce supply and enduring desirability hold their pull regardless of where the new offices go. The map of rising prices tracks both where the jobs are and where the old money stays.
In Thane, the Complaint Signal Stays Flat While Connectivity Does the Work
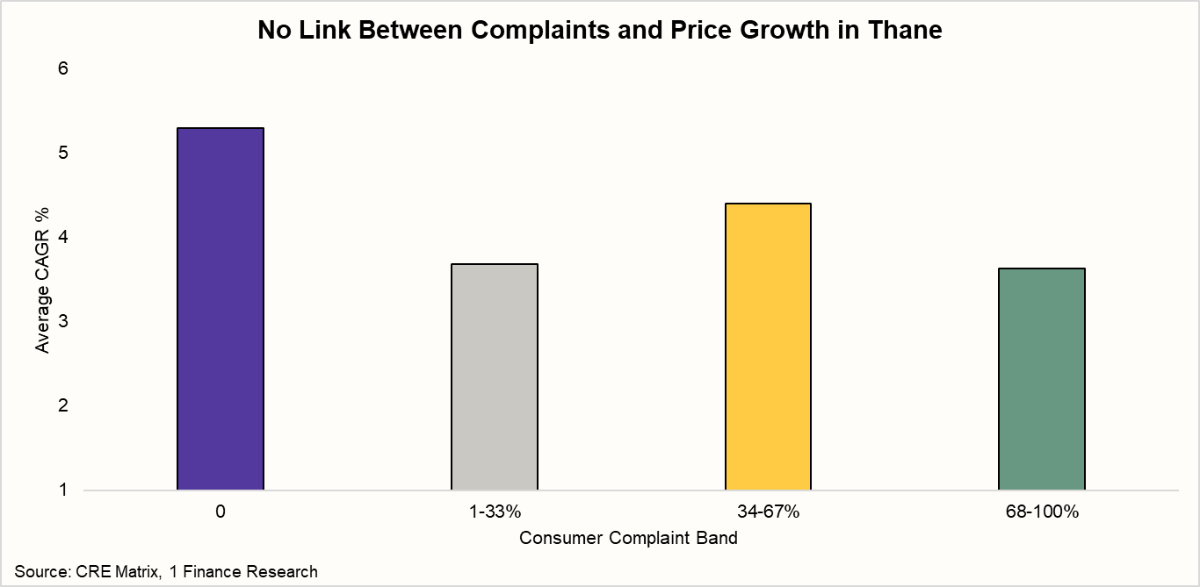
Thane echoes Mumbai. The zero-complaint band leads at 5.3%, but the 1-33% band again underperforms the 34-67% band (3.7% vs 4.4%), the wrong way round if complaints were priced in, and the worst band still returns 3.6%. Returns don't decay with grievances; they wobble around them.
What sorts of Thane's markets are infrastructure? Four of the five best-performing micromarkets in the district cluster in Navi Mumbai.
| Micromarket | Latest PSF | YoY | 3-Year CAGR | Macromarket |
|---|---|---|---|---|
| Juinagar | ₹17,599 | 42% | 3% | Navi Mumbai |
| Sanpada | ₹30,503 | 31% | 14% | Navi Mumbai |
| CBD Belapur | ₹20,523 | 30% | 1% | Navi Mumbai |
| Ghansoli | ₹22,244 | 19% | 4% | Navi Mumbai |
| Kalwa | ₹17,809 | 19% | 4% | Thane City |
The split within the district is stark. Navi Mumbai's planned belt, with wide roads, organised grids and direct rail and road links into Mumbai, soon reinforced by the new airport corridor, keeps appreciating. The rest of Thane tells the opposite story; congested, narrow roads and weak connectivity into Mumbai leave those micromarkets lagging on price. Within one district, infrastructure is doing all the sorting.
Pune Is the Cleanest Proof That Complaints Don't Price Returns
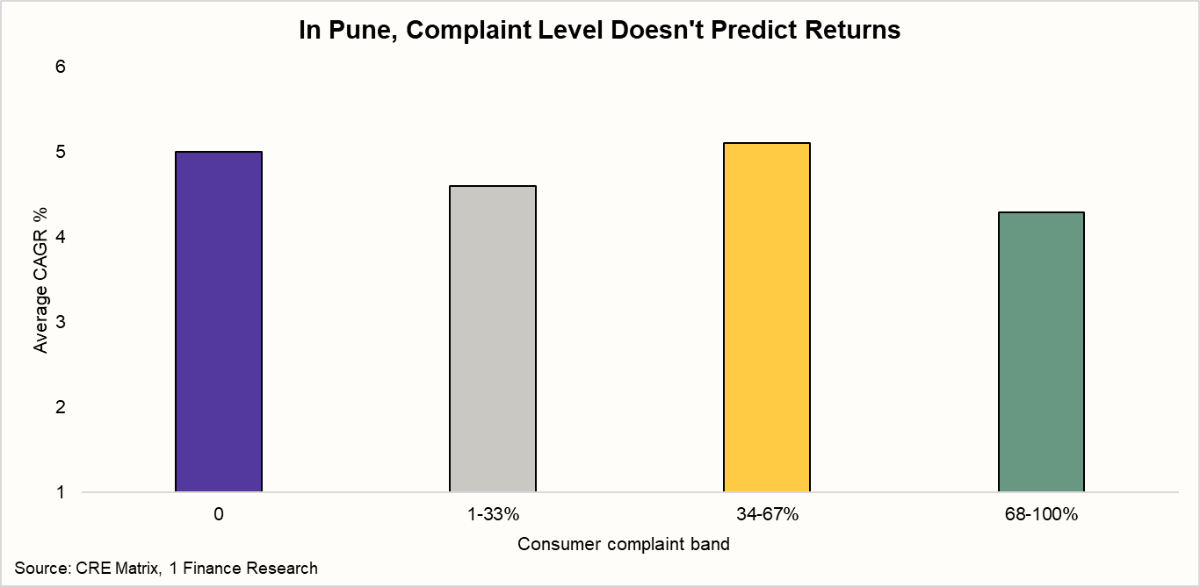
Pune is almost a flat line. Every complaint band returns between 4.3% and 5.1%, a spread of under one point, and the heavily-complained 34 to 67% band is the single best performer at 5.1%, ahead of the complaint-free band at 5.0%. The grievance data and the return data are unrelated. Whatever Pune buyers are paying for, the developer's complaint record plays no part in it.
Gurugram Re-Rated as Delays Collapsed
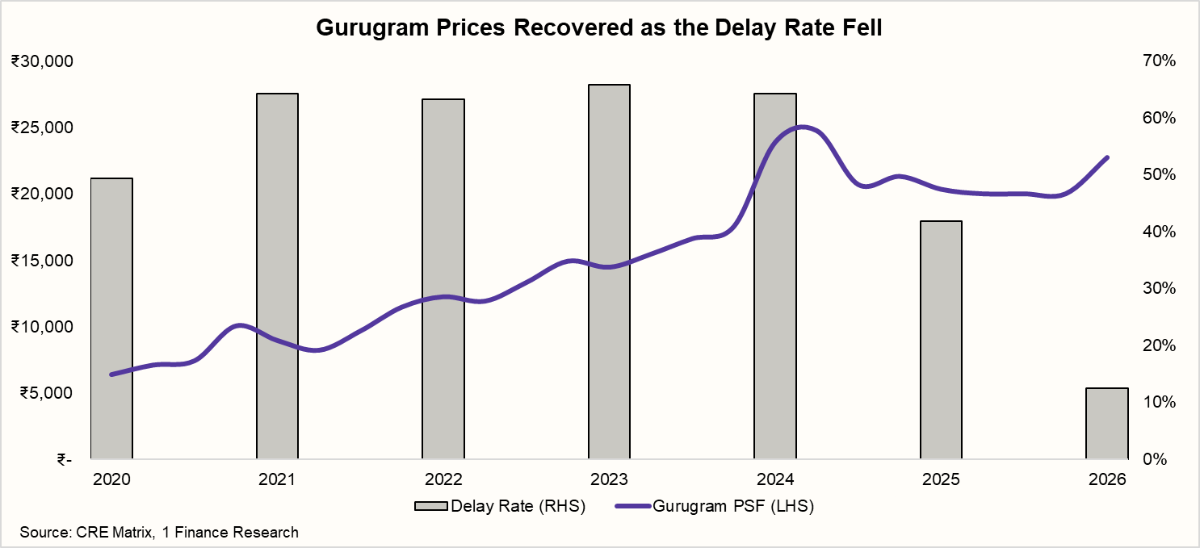
Heavy delays weighed on Gurugram. As the delay rate stayed elevated through 2025, PSF slipped from its 2024 peak of roughly ₹24,700 to below ₹20,000. That has reversed as developer execution improved; with the delay rate down to roughly 12%, PSF has risen again to ₹22,722 by mid-2026. When developers deliver on time, buyers pay a premium for that certainty.
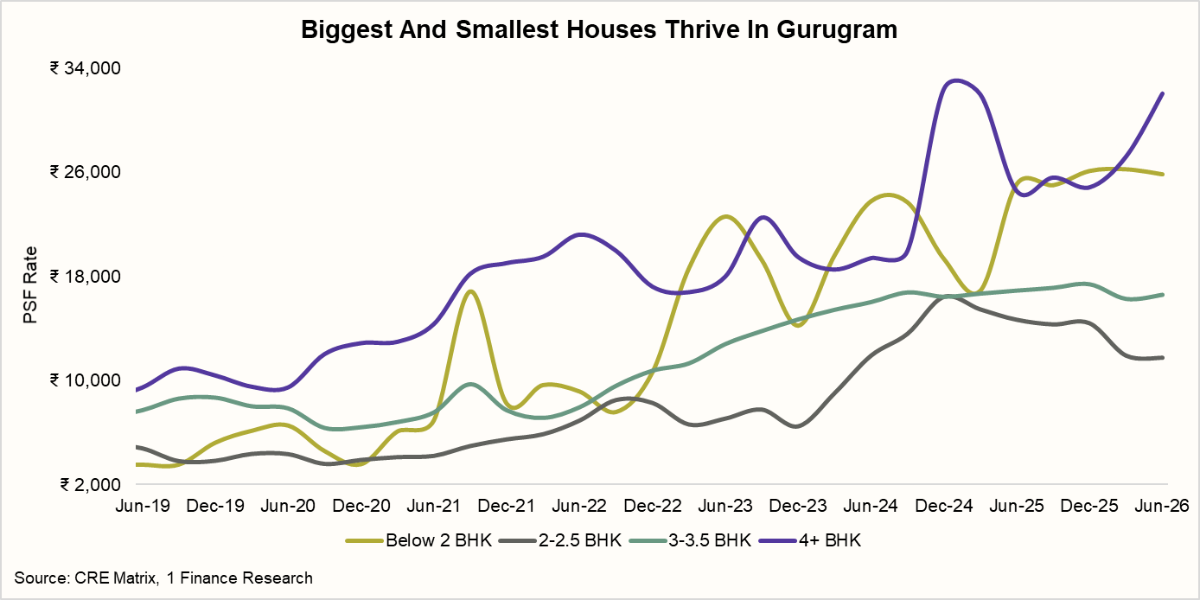
The configuration split in Gurugram is striking, and it is the middle that struggles. At the top, a segment is willing to pay almost any luxury price. 4+ BHK units, the most heavily priced in the market at ₹32,013 PSF, are still up 30.6% YoY with a three-year CAGR of 21.3%, as HNIs, startup founders and senior corporate buyers chase trophy addresses. The smallest units are also heavily priced; Below-2-BHK trades at ₹25,837 PSF, second only to the 4+ BHKs. These compact units draw two kinds of buyers: young working professionals who want a home close to the office and investors who buy to rent out, since companies and working tenants are always looking for such flats. The flats are small, so the total cost stays affordable, but on a per-square-foot basis they are priced like luxury.
The squeeze sits in the middle. The 2 to 2.5 and 3 to 3.5 BHKs cater to the classic mid-income family buyer, salaried households upgrading into a family home, and that segment fell 19.7% YoY to ₹11,371 and slipped 1.9% to ₹16,534, respectively.
| Configuration | Latest PSF | YoY | 3-Year CAGR | Overhang (months) |
|---|---|---|---|---|
| Below 2 BHK | ₹25,837 | 2.9% | 4.6% | 20.9 |
| 2 to 2.5 BHK | ₹11,371 | -19.7% | 18.6% | 15.3 |
| 3 to 3.5 BHK | ₹16,534 | -1.9% | 9.1% | 14.7 |
| 4+ BHK | ₹32,013 | 30.6% | 21.3% | 9.1 |
Inventory overhang tells the same story. Overhang measures how many months it would take to sell all the unsold homes in a segment at the current pace of sales; the lower the number, the stronger the demand. The contrast is sharp. 4+ BHK carries the lowest overhang in the market at just 9.1 months while also delivering the fastest price growth, so luxury stock is selling quickly even as it gets more expensive. The middle shows the reverse; 2 to 2.5 BHK sits on 15.3 months of overhang with prices down 19.7%, and 3 to 3.5 BHK on 14.7 months with prices slipping 1.9%, unsold stock piling up and prices falling together.
Noida Rewards Delivery and Shuns Distress
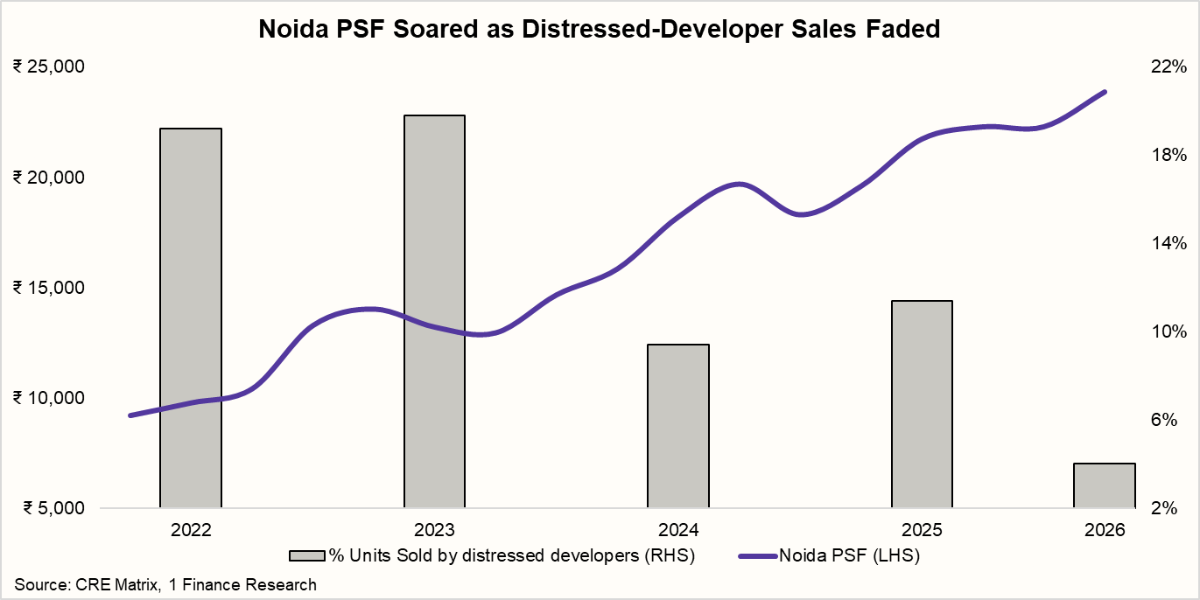
Noida is the mirror image of Gurugram's delay story. As the share of sales coming from distressed developers fell from around 20% to just 4%, PSF soared. Buyers are actively rejecting units from troubled builders and paying up for credible ones. Once again, the price signal is about execution and developer health, not the complaint ledger.
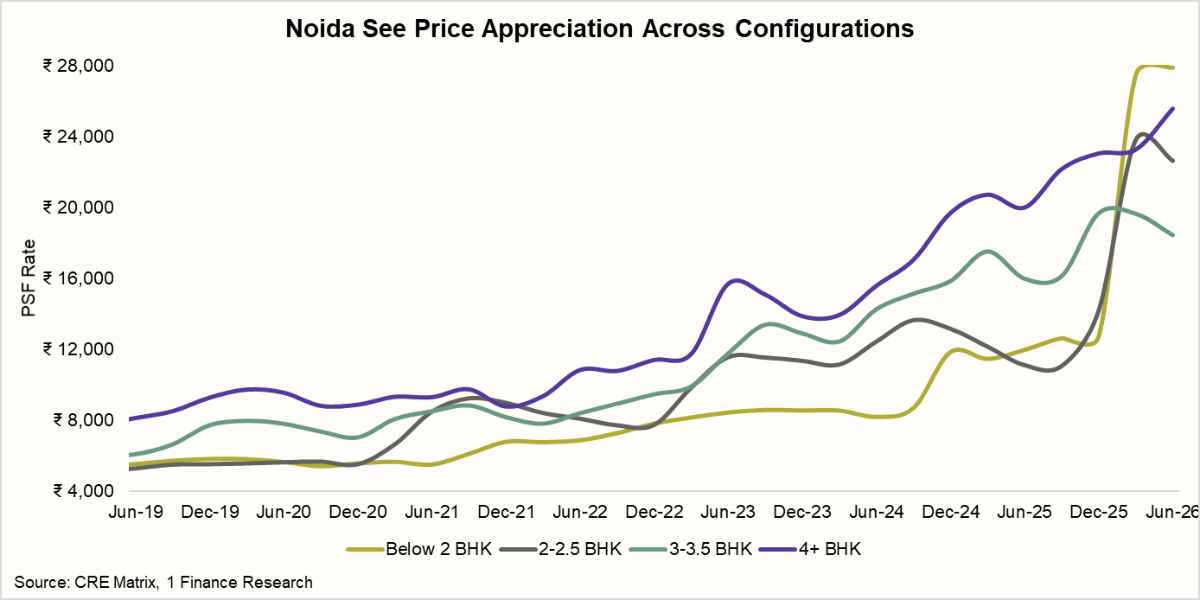
When every configuration is rising, the growth is organic, with demand coming from all kinds of buyers rather than one small group. This is how a market should grow. Noida's civic base supports it too. As a planned city under a single authority, it has wider roads laid on an organised grid, functioning drainage and a connected sewage network, so it largely escapes the monsoon waterlogging that routinely swamps even Gurugram's premium sectors. Its metro coverage is denser, its expressways signal-free, and the newly opened Noida International Airport at Jewar, which began commercial operations in June 2026, has given it its own air gateway with more road and metro links under construction. Better liveability across the board is exactly what draws buyers across the board.
Hyderabad Struggles Across Every Configuration
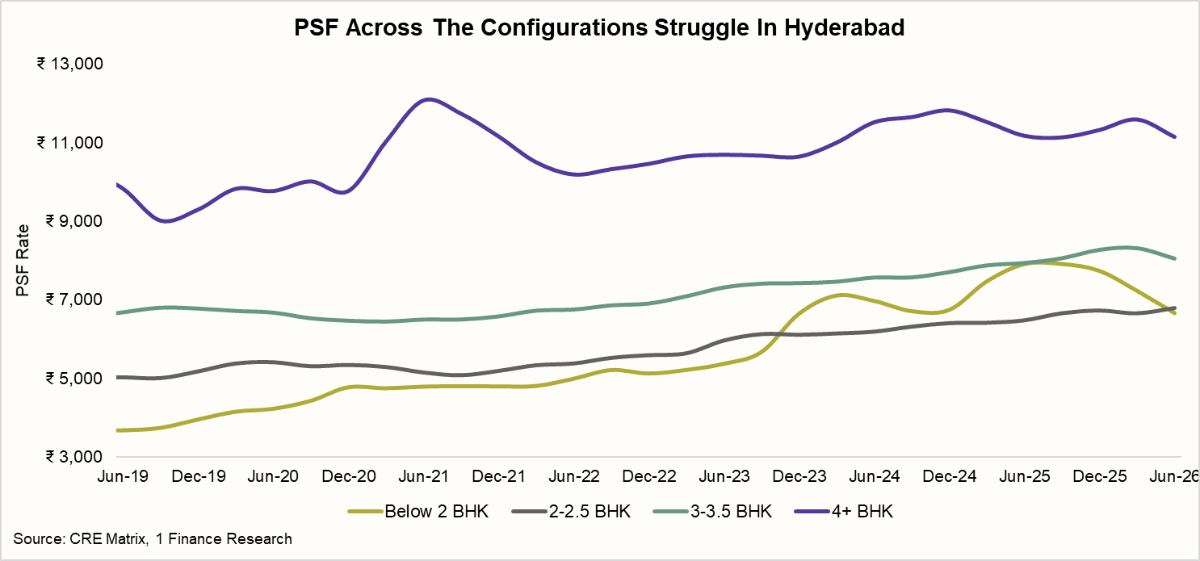
Hyderabad is the soft spot. PSF across configurations has struggled, and the YoY numbers make it plain. Below-2-BHK fell 15.8% YoY to ₹6,655, 4+ BHK slipped 0.3% to ₹11,140, while 2 to 2.5 BHK (+4.8%, ₹6,790) and 3 to 3.5 BHK (+1.4%, ₹8,034) barely moved. This is a structural problem, the complete opposite of Noida. Where Noida rises across every configuration, Hyderabad struggles across every configuration; no segment of buyer, from the 1 BHK owner to the 4 BHK owner, is earning meaningful returns. When weakness cuts across every price point, it isn't one segment out of favour. The market itself lacks demand, and there is no strong segment to pull the rest along.
Where growth exists, it is highly localised. Seven of the ten best-performing micromarkets sit in the Northwest, led by Ameerpet at +120% YoY (₹11,000), with Mallampet, Kandlakoya, Muthangi, Erragadda, Puppalaguda and Kukatpally alongside it. Budwel (+96%) and Shamshabad (+41%) in the Southwest and Devarayamjal (+78%) in the Northeast round out the list. These pockets cluster around the IT and pharma job corridors, the same jobs-drive-prices logic seen in Mumbai.
| Micromarket | Latest PSF | YoY | 3-Year CAGR | Macromarket |
|---|---|---|---|---|
| Ameerpet | ₹11,000 | 120% | 34% | Northwest |
| Budwel | ₹13,066 | 96% | 33% | Southwest |
| Devarayamjal | ₹12,299 | 78% | 25% | Northeast |
| Mallampet | ₹8,180 | 60% | 8% | Northwest |
| Kandlakoya | ₹9,320 | 48% | 14% | Northwest |
| Shamshabad | ₹11,404 | 41% | 8% | Southwest |
| Muthangi | ₹6,989 | 41% | 14% | Northwest |
| Erragadda | ₹11,354 | 39% | 15% | Northwest |
| Puppalaguda | ₹10,129 | 36% | 16% | Northwest |
| Kukatpally | ₹12,631 | 31% | 16% | Northwest |
Bengaluru Shows What Organic Growth Looks Like
Bengaluru rounds out the picture with the most balanced configuration profile. Like Noida, every format is in positive territory, which means every owner, from the 1 BHK to the 4 BHK, is earning returns here. Compact homes lead; Below-2-BHK rose 18% YoY to ₹11,362, and 2 to 2.5 BHK rose 20% to ₹10,501, with larger homes appreciating steadily too, 3 to 3.5 BHK up 9% (₹11,301) and 4+ BHK up 8% (₹13,868).
Bengaluru also shows, even more cleanly than Gurugram, why overhang matters. The two configurations with the least overhang are also the fastest growers. The pattern is simple; the homes selling fastest are also the ones rising fastest in price.
| Configuration | Latest PSF | YoY | 3-Year CAGR | Overhang (months) |
|---|---|---|---|---|
| Below 2 BHK | ₹11,362 | 18% | 13% | 11.9 |
| 2 to 2.5 BHK | ₹10,501 | 20% | 12% | 15.6 |
| 3 to 3.5 BHK | ₹11,301 | 9% | 8% | 18.5 |
| 4+ BHK | ₹13,868 | 8% | 10% | 27.2 |
What Advisors Should Do With This
The Q2 2026 picture points to three patterns worth carrying into the rest of the year.
First, the public grievance record is the wrong filter. Across Mumbai, Thane and Pune, the complaint ledger fails to explain returns; consumers are simply not taking complaints into account when they buy, so complaints never get priced in. What buyers do reward is delivery. Gurugram re-rated as its delay rate collapsed, and Noida re-rated as distressed-developer sales faded. For clients evaluating a purchase, the diligence has to go one level deeper than the RERA complaint page, into who actually delivers on time and which developers are financially healthy.
Second, jobs and infrastructure set the geography of price. Mumbai's Western suburbs, Thane's Navi Mumbai belt and Hyderabad's Northwest all outperform for the same reason: proximity to employment and the roads, rail and connectivity that shorten the commute. Areas that get the infrastructure keep gaining; areas that don't, like most of Thane district outside Navi Mumbai, lag.
Third, the healthiest markets are the ones where every configuration earns. Noida and Bengaluru show what organic growth looks like. Gurugram's gains sit at the two ends of the market with a squeezed middle, and Hyderabad struggles across every price point with no strong segment to pull the rest along.