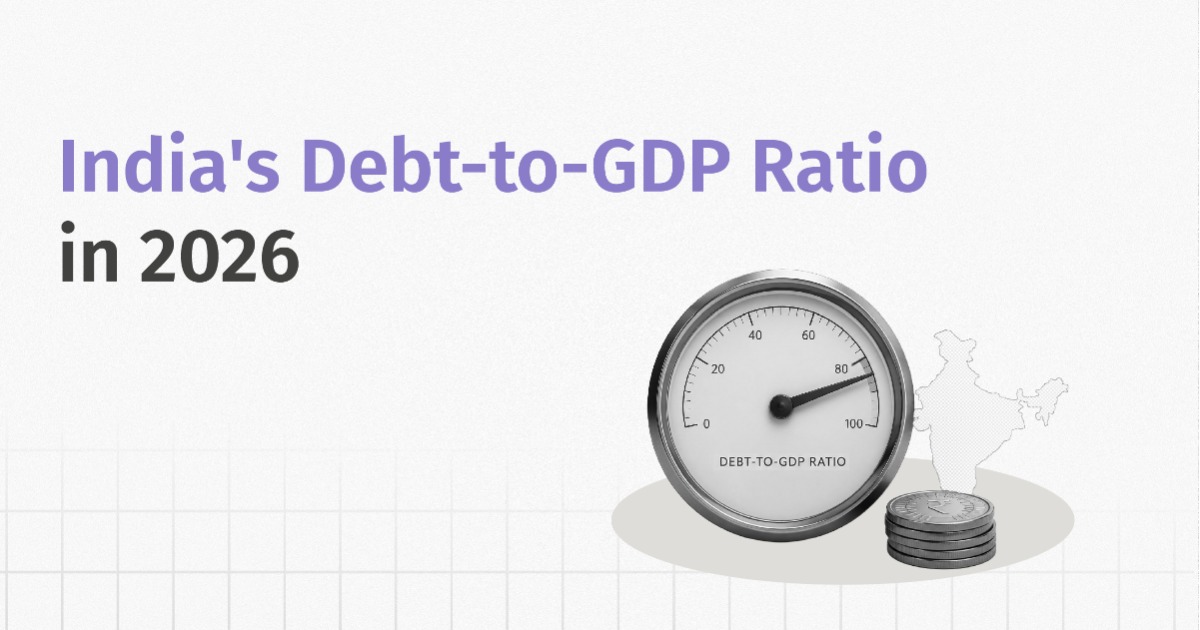
Reports of India's debt-to-GDP ratio hitting 100% (centre + state) by 2028 have circulated widely, drawn from a worst-case scenario in an IMF review. The actual general government figure for FY26 stood at 84.41%, provisional, up slightly from 83.22% in FY25, though still well below the 91.74% seen during the pandemic year of FY21. That mixed picture, a small uptick over the past year sitting inside a longer multi-year decline, is the story worth understanding here, not just a single headline number.
India’s own target is to have debt at 50±1% (central) of GDP by FY31
That gap comes down to how the ratio is actually built, and what has kept it moving in India's favour so far.
What Debt-to-GDP Means And Why The Denominator Matters
Debt-to-GDP is a government's total outstanding debt divided by the size of the economy that year. It looks like a simple ratio, but the two sides move for different reasons, and most coverage of India's debt only looks at one of them.
| 💡Debt-to-GDP ratio = (Total outstanding government debt ÷ Nominal GDP) × 100 |
The numerator is the debt stock, and it only grows. Every year the government runs a fiscal deficit, it borrows to cover the gap, and that borrowing adds to the pile. This side rarely shrinks in nominal terms.
The denominator is nominal GDP, and this is what actually decides the ratio's direction. If the economy grows faster than the debt stock, the ratio falls even as the debt itself gets larger. If growth slows below the pace at which debt is piling up, the ratio rises.
This is why India's ratio has been easing even as the government keeps borrowing. Nominal GDP is growing close to 10% a year, against an average interest cost on the debt closer to 7%. As long as that gap holds, the ratio drifts down without any deficit cut. Close it, through slower growth or costlier borrowing, and the arithmetic flips fast.
| 💡 Reading the Ratio Below 40 to 50% is generally low risk. Above 90 to 100% draws real scrutiny, though Japan runs past 200% without a crisis. What matters more than the number is who holds the debt and whether growth is outpacing it. India, at 84.41%, sits in the higher-but-manageable range, mostly domestic debt, backed by fast growth. |
What Is India's Fiscal Deficit, and How Does It Link to Debt-to-GDP
Fiscal deficit is the gap between what the government spends in a year and what it collects through taxes and other revenue. When spending outpaces income, the government borrows to cover the difference, and that borrowing is the fiscal deficit, usually expressed as a percentage of GDP so it's comparable across years.
| Fiscal Deficit vs Debt-to-GDP | ||
|---|---|---|
| Fiscal deficit | Debt-to-GDP | |
| What it measures | Fresh borrowing added in a single year | Total accumulated debt carried forward |
| Type | Flow - a transaction measured over a period | Stock - a position measured at a point in time |
| Resets each year | Yes | No, builds on the previous year's stock |
| FY26 figure | 4.4% of GDP | 84.41% of GDP (general government) |
| What moves it | Government spending vs revenue collected | Fiscal deficit added, minus GDP growth |
| Can rise while the other falls | Yes, a wide deficit can still coincide with a falling ratio if GDP grows fast enough | Yes |
Fiscal deficit and debt-to-GDP get used interchangeably, but they aren't the same thing. Fiscal deficit is the flow, what gets borrowed fresh each year. Debt-to-GDP is the stock, the full balance carried forward. The chart below shows that flow, fiscal deficit against nominal GDP growth, which is the input behind the debt-to-GDP trend covered next.

The chart shows a clear counter-cyclical relationship between fiscal deficit and economic growth, particularly around the pandemic period. Before FY20, GDP growth remained relatively strong while the fiscal deficit was contained at around 6–7% of GDP. In FY21, GDP contracted sharply while the fiscal deficit surged to about 13% as government spending increased to support the economy. This fiscal expansion was followed by a strong growth rebound in FY22. Since then, both indicators have gradually normalised: GDP growth has moderated from its post-pandemic peak, while the fiscal deficit has steadily declined, reaching around 4–5% of GDP by FY26. Overall, the trend suggests a shift from crisis-driven fiscal support towards fiscal consolidation as economic conditions stabilise.
Recommended for you
Readers also explored
India’s Unemployment Rate in 2025
 7 min read

Nifty 50 Companies List 2025 : Top 50 Stocks in India
7 min read
The Three Measures Of India's Debt-To-GDP Explained
India's debt-to-GDP isn't one number. Depending on which measure a report uses, it can read anywhere from the low 20s to the mid 80s, and most confusion comes from mixing up three different things.
The most quoted number is the central government's own debt against GDP, tracked against the finance ministry's fiscal glide path. A wider measure, the IMF's preferred one for sustainability analysis, adds the states' borrowing on top. A third, much smaller number covers only foreign currency debt, a separate vulnerability measure rather than a domestic fiscal one.
| India's debt-to-GDP, by measure, FY26 | |||
|---|---|---|---|
| Measure | FY26 figure | Absolute value | What it captures |
| Central government debt-to-GDP | 55.21% | ₹197.18 lakh crore | The Centre's own outstanding debt, tracked against the FRBM glide path |
| General government debt-to-GDP (Centre plus states) | 84.41% | Approximately ₹300 lakh crore combined | Centre's debt plus states' debt, the IMF's preferred sustainability measure |
| External debt-to-GDP | 20.2% | ₹ 7.21 Lakh Crore | Foreign currency liabilities only, not additive to the other two |
The general government figure is the one worth carrying forward, since it's closer to what drives the IMF's sustainability projections than the Centre-only number that usually makes headlines. External debt stays a separate, smaller thread, worth tracking on its own.
| 💡 Why India's Own Target Looks Smaller Than the IMF's India's official 50±1% by FY31 target covers central government debt alone, since states set and answer for their own borrowing under separate state laws. The IMF's comparisons use the combined Centre-plus-states figure instead, for consistency across countries. Not a discrepancy, just two different, both valid, ways of measuring the same debt. |
India's Central And State Debt-to-GDP
Central government debt stood at 55.21% of GDP in FY26, easing from 55.33% in FY25. States added another 29.2%, bringing the general government total, Centre plus states combined, to roughly 84.4% of GDP.

While the Centre accounts for a large part of India’s public debt, state governments also carry a significant debt burden. But this debt is not distributed uniformly across states. Looking at the state-wise position therefore helps us understand where state government liabilities are concentrated, rather than relying only on the aggregate number.

The chart shows considerable variation in outstanding liabilities across states. Andhra Pradesh stands out with liabilities of over ₹10 lakh crore, followed by Arunachal Pradesh and Assam in this dataset. However, a larger debt stock does not automatically mean greater fiscal stress, as the size of state economies also differs considerably. Absolute debt should therefore be viewed alongside debt-to-GSDP when assessing the actual burden on individual states.
India's External Debt-to-GDP, The Smaller But Rising Slice
External debt is money owed to lenders outside India, borrowed in foreign currency rather than rupees. It comes from commercial borrowing by Indian companies and banks, non-resident deposits, trade credit, and government loans from institutions like the World Bank and IMF, with multilateral and government-to-government loans typically the cheapest and longest-term of the lot.

India's external debt stood at $762.8 billion at the end of March 2026, 20.2% of GDP, up from 19.8% a year earlier. The dollar dominates at 55.5% of the total, and rupee-denominated debt makes up 29.4%. Short-term borrowing has been growing faster than long-term debt, its share rising to 19.6% from 18.3%, worth watching even though the overall level stays low by historical standards.

Internal vs External Debt, and Which One Carries India's Burden
Internal debt is borrowed in rupees from Indian lenders. External debt is borrowed in foreign currency from lenders outside India. Of the central government's own debt, internal debt does almost all the work, around 95%, and external debt just 5%. This is separate from foreign ownership of India's rupee-denominated bonds, covered earlier, where foreign investors hold about 3%, and from India's total external debt of 20.8% of GDP, which includes companies and banks, not just the government.
| Internal vs external debt | ||
|---|---|---|
| Internal debt | External debt | |
| Currency | Rupees | Foreign currency (mostly USD) |
| Lenders | Indian banks, insurers, pension funds, RBI | World Bank, IMF, foreign governments, commercial lenders |
| Currency risk | None | Yes, a weaker rupee raises the repayment cost |
| Depends on | Domestic investor demand | Global investor sentiment |
| Share of central government's own debt | Around 95% | Around 5% |
How India's Debt-to-GDP Compares Internationally
India's 83% debt-to-GDP puts it in an unusual position, too high to be called fiscally conservative, but nowhere near the danger zone advanced economies routinely operate in. The US, at 126%, and Japan, at a striking 204%, both carry far heavier loads while still borrowing cheaply and comfortably, because markets judge their debt on more than the headline number.
That's the real comparison worth making. Germany, at 65%, shows a high-income economy can choose to run lean; its constitutional "debt brake" is a deliberate policy stance, not an accident of geography. Japan shows the opposite, a ratio two and a half times India's, yet considered low risk because virtually all of it is held domestically in yen.

India's own position borrows from both stories. Like Japan, its debt is overwhelmingly domestic and rupee-denominated, which limits the currency and rollover risk that would worry investors in a more externally-financed economy. Unlike Japan, India also has growth on its side, nominal GDP expanding near 10% a year, a pace none of the advanced economies on this comparison come close to matching. That combination, safe composition plus fast growth, is why 83% reads as manageable rather than alarming, even sitting above emerging market peers like Indonesia (41%) and South Africa (79%).
Is India's Debt-to-GDP Sustainable
What matters more than the ratio itself is who holds the debt. Nearly all of it is domestic and rupee-denominated; commercial banks hold around 33%, insurance companies 25.6%, the RBI 17.6%, pension and provident funds 9.1%, while foreign investors hold just 3%. That limits currency risk and dependence on foreign capital.

Refinancing risk is genuinely low, and the numbers back it up rather than just the "domestic holders" logic. The weighted average maturity of India's outstanding government debt has been rising for years, from 9.7 years in FY10 to over 12.5 years by FY24, and new debt being issued today carries even longer maturities, close to 18 to 19 years on average. That's a deliberate strategy, not an accident; the government has been actively lengthening its debt profile so less of it comes due in any single year.
The practical effect is that only around 5 to 6% of the total outstanding stock needs to be rolled over annually. A market disruption or a bad quarter for bond demand would only threaten a small sliver of debt at any given time, not the whole pile at once, and the government further manages this through periodic bond buybacks and switches, swapping shorter-dated bonds for longer ones to smooth out any lumpy repayment years ahead of time.
How the Government Manages Debt-to-GDP, and Whether the Tools Work
| Tool | What it does |
|---|---|
| FRBM Act, 2003 | Sets legal fiscal deficit and debt targets for the Centre, with a mandatory annual statement to Parliament |
| Debt-to-GDP glide path (Budget 2026-27) | Replaced separate deficit targets with one anchor, debt at 50±1% of GDP by FY31 |
| State Fiscal Responsibility Legislation | Each state's own version of the FRBM Act, capping fiscal deficit at 3 to 3.5% of GSDP |
| Statutory Liquidity Ratio (SLR) | Requires banks to hold government securities, built-in steady demand for debt |
| Maturity elongation | Longer-tenure bonds plus buybacks and switches, lowering annual rollover pressure |
| Escape clause | Lets the government exceed targets in emergencies, used during Covid |
The record is mixed. The FRBM Act cut the deficit sharply in its early years and forces yearly transparency, but its original 3% target has been missed and reset repeatedly, and combined Centre-plus-state debt still sits above the Act's original 60% ceiling.
The debt management side has worked better. Longer maturities and a captive domestic buyer base haven't forced lower spending, but they've kept the debt easier to service, which is likely why the ratio has stayed manageable even through years the targets were missed.
What To Track Next: High Frequency Indicators For India's Debt-To-GDP
A high debt-to-GDP ratio isn't dangerous by itself, but it narrows the government's room to act. More of each year's revenue gets tied up servicing old debt, leaving less for new spending. Borrowing costs can rise as investors demand a higher return to hold more debt. A weaker currency or inflation shock hits harder, since there's less fiscal cushion to absorb it. And if growth ever falls below the interest rate on the debt, the same arithmetic that's been easing the ratio flips into raising it instead.
None of this describes India's current position, but it's exactly why the ratio is worth watching between official releases rather than checking in once a year. These eight indicators move often, and together they signal which way the ratio is likely headed before the number itself gets published.
| High-frequency indicators to track India's debt-to-GDP ratio | |||
|---|---|---|---|
| Indicator | Impact | Recent figure | Forecast |
| Fiscal deficit as % of Budget Estimate | Pace of fresh borrowing against the year's plan | 21.4% of the FY27 target by April-end 2026 | Full-year target set at 4.3% of GDP, down from 4.4% in FY26 |
| Interest payment run rate | Debt servicing burden building through the year | Interest to revenue receipts ratio at 37.6% in FY26, provisional | Expected to keep easing gradually as the FRBM glide path plays out |
| G-sec borrowing calendar | Pace of market borrowing against the annual plan | On track with the H1 FY27 auction calendar so far | Full-year gross borrowing sized to the ₹16.96 lakh crore fiscal deficit target |
| 10-year G-sec yield | Market pricing of rollover and sustainability risk | Around 6.83 through July 2026 | Direction hinges on inflation trajectory and global crude prices |
| RBI external debt release | Foreign currency liability trend | 20.8% of GDP at end-March 2026, up from 19.8% | Next quarterly release due to show whether the recent uptick continues |
| CPI inflation | Drives nominal GDP growth and RBI rate decisions | 4.38% in June 2026, an 18-month high | Analysts expect it to cross 5% by August-September, nearing 6% by December |
| India 10-year G-sec spread over US Treasuries | Relative market confidence in India's sovereign risk | Narrowed on steady FPI demand through mid-2026 | Watch for widening if inflation or fiscal slippage resurfaces |
| FII flows into Indian debt | Foreign appetite for India's government paper | Around $1.84 billion into government bonds over June and July 2026 | Analysts flag rupee pressure as a risk to sustained inflows |
The fiscal deficit and CPI inflation rows are worth watching together; they're the two halves of the growth versus interest rate mechanism from Section 1 playing out in real time. Inflation accelerating toward 6% while the deficit runs hot is the early combination that would eventually show up as a rising ratio, well before the year closes.
What This Means For Investors And Advisors
For investors, a moderating debt-to-GDP ratio and narrowing sovereign spreads are a quiet tailwind for bond markets; lower perceived risk supports rating upgrades, which pulls down borrowing costs and yields more broadly. Long-duration debt funds stand to benefit most from this. The one risk that could interrupt it is inflation, tracking toward 5 to 6% by year end, which could force the RBI's hand and reverse the trend.
For advisors, four conversations this data grounds well:
- Debt fund duration. Clients sitting in short-duration funds out of caution about "India's debt problem" have a concrete reason to revisit that; a stable to improving fiscal trajectory generally favours going longer.
- G-sec allocation timing. Clients building fixed income positions directly in G-secs can track fiscal deficit prints, CPI, and G-sec yields as an actual monitoring checklist rather than a vague sense of when to act.
- State-level exposure. For clients holding State Development Loans, remember that state debt to GSDP ranges from roughly 14% to 57%; "government debt" isn't one uniform credit; some states carry more risk than others meaningfully.
- The IMF's 100% headline. When a client raises this, the fastest reframe is ownership: nearly all of India's debt is domestic and rupee-denominated, which is what actually determines risk, not the headline ratio alone.
Conclusion
India's debt-to-GDP ratio draws attention, but the story underneath is steady improvement, not crisis. Central government debt eased to 55.21% of GDP in FY26, states added another 29.2%, and both have been falling since the pandemic pushed them to their FY21 peak.
What keeps this manageable is simple. Nominal GDP is growing close to 10% a year, faster than the average cost of servicing the debt, and nearly all of it is domestic, rupee-denominated debt, not owed to foreign lenders who could pull back quickly. Placed next to other major economies, India's ratio sits below the US, UK, France, and Japan.
None of this makes the debt costless, and the growth-interest gap driving the improvement isn't guaranteed to hold. For now, though, the arithmetic is working in India's favour, and the monthly indicators covered above are the ones that would flag it first if that changed.