The RBI has pulled in $52.3 billion of foreign currency deposits in nine weeks and closed the window a month early because the response ran ahead of what it planned for. On the face of it that is the strongest external-account news India has had this year. The rupee is still at 95.8 to the dollar. Inflation has now risen for nine consecutive months.
The money that arrived is borrowed; it carries a three- to five-year clock, and the RBI is paying the hedging cost on it. What India has bought is time. Our view is that the time is being used to rebuild buffers rather than to defend the currency, which explains why the inflows and the exchange rate have moved in opposite directions, and it changes what advisors should expect from here.
| Key Takeaways |
|---|
|
|
|
|
|
|
What Actually Came In, and What It Costs
The headline inflow number circulating this month is $56.85 billion. That is the total across three channels as of 13 August, not the FCNR(B) figure. The split matters because the three carry different maturity profiles and different deadlines.
| Inflows Under the Special Swap Facility, as of 13 August 2026 | |||
|---|---|---|---|
| Channel | Amount | Window status (Before) | Window Status (After) |
| FCNR(B) deposits | $52.30 bn | 30th Sept 2026 | 31st August 2026 |
| Overseas foreign currency borrowings | $2.81 bn | Open until 31 Dec | Open until 31 Dec (unchanged) |
| External commercial borrowings | $1.74 bn | Open until 31 Dec | Open until 31 Dec (unchanged) |
| Total | $56.85 bn | - | - |
The facility opened on 8 June. Banks raise FCNR(B) deposits from non-residents for three to five year tenors, sell the dollars to the RBI in multiples of $1 million, receive rupees in return, and agree to buy the dollars back when the swap matures. The RBI absorbs the currency-hedging costs. That is the incentive, and it is also a quasi-fiscal cost sitting on the central bank's books rather than the Budget's.
Recommended for you
Readers also explored
What a Weak Rupee Near 90 Means in 2026
 13 min read

World GDP Breakdown 2025: Who Powers the Global Economy?
8 min read
Two things follow that nobody is writing about.
First, this is not reserve accretion in the ordinary sense. These are dated liabilities with a repayment schedule. India ran the same playbook in 2013 and raised $26 billion; the RBI covered roughly 80% of it in the forwards market, and the redemptions passed without disruption. This round is twice the size, and the repayment window opens in FY30.
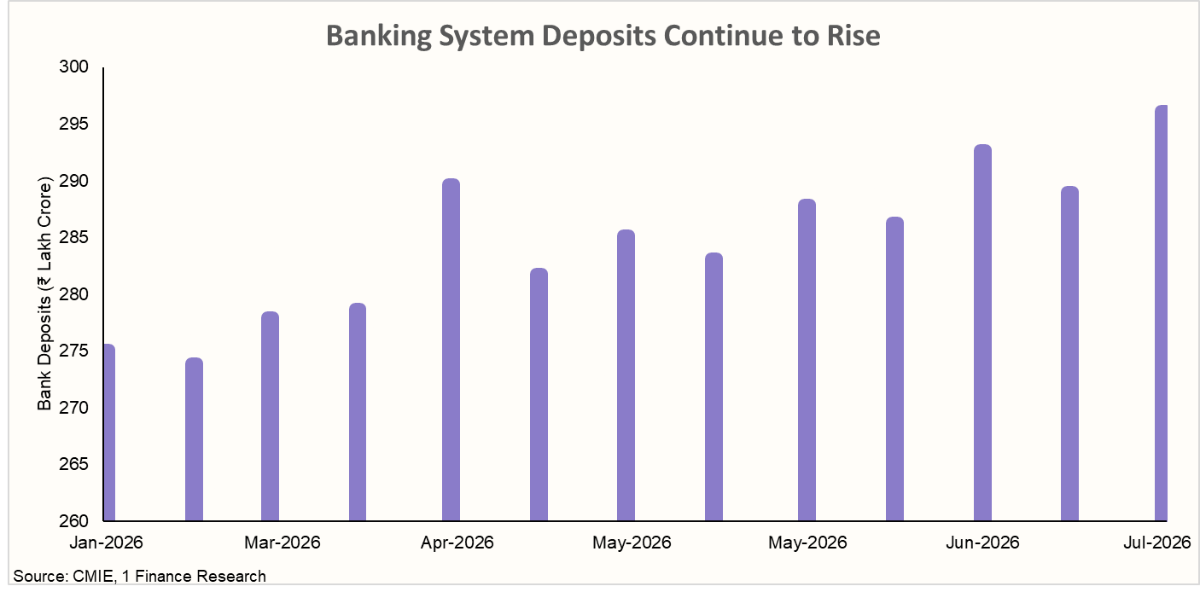
Second, the dollars did not stay dollars. Banking system deposits rose ₹11 lakh crore over the three fortnights to 31 July, taking total deposits to a record ₹269.4 lakh crore, with market participants attributing a large part of that to FCNR conversions into rupees. That is the transmission channel that matters domestically, and it runs through liquidity and bond yields rather than through the exchange rate.
The Buffers Have Improved, But the Mix Skews Temporary
India's external position has improved on paper. Forex reserves rose from $667 billion in June to $693 billion in July, a gain of $26 billion, while net FII/FPI flows swung from $531 million in June to $4.19 billion in July. Add the $52.3 billion mobilised through FCNR(B) by 13 August, and foreign currency liquidity has rarely looked this comfortable.
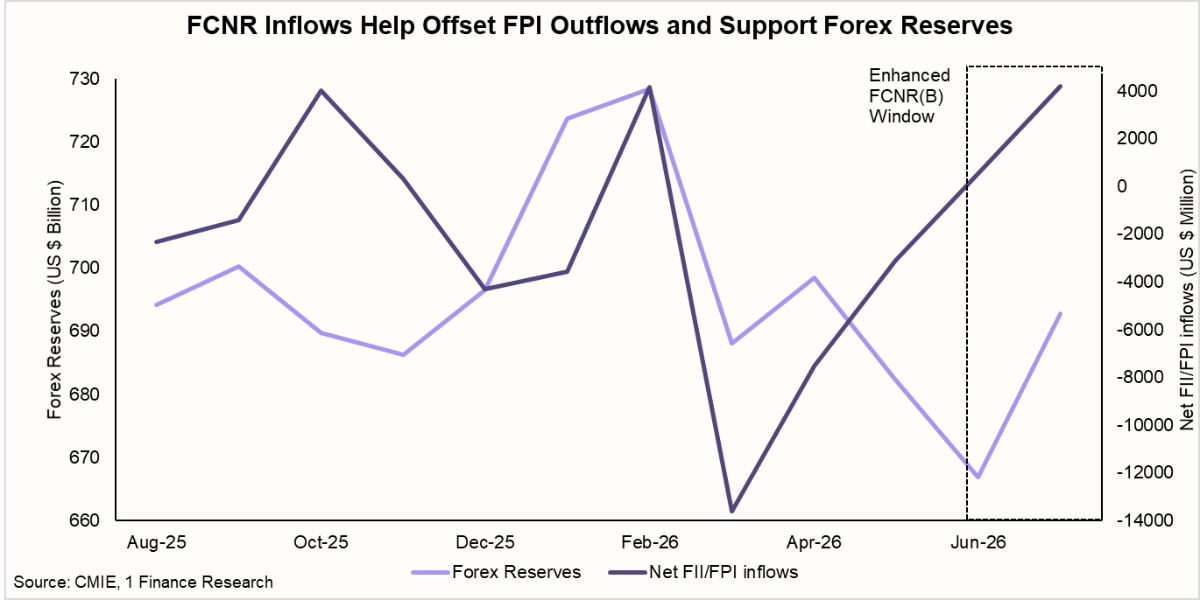
The composition is the problem. FPI flows reverse on a single shift in risk sentiment, and the FCNR(B) window is a source of borrowed dollars with a repayment date attached. Between February and March 2026, FII/FPI flows collapsed to close to negative $14 billion and dragged reserves down with them. The recovery since June is a swap facility doing work that portfolio flows were not doing on their own.
We would treat this as a liquidity cushion rather than a structural improvement in external resilience. The monitorable is whether FPI flows hold through September without FCNR(B) support behind them. That is what separates a genuine change in sentiment from a chase for yield ahead of a closing window.
The Rupee Stopped Falling, It Did Not Recover
The rupee has been broadly range-bound since the facility opened. USD/INR averaged 95.06 in June, 95.98 in July and 95.31 through the first half of August, and traded near 95.7 on 19 August. The record low of 96.88 came on 23 July, and the currency has recovered a little under 1% from there.
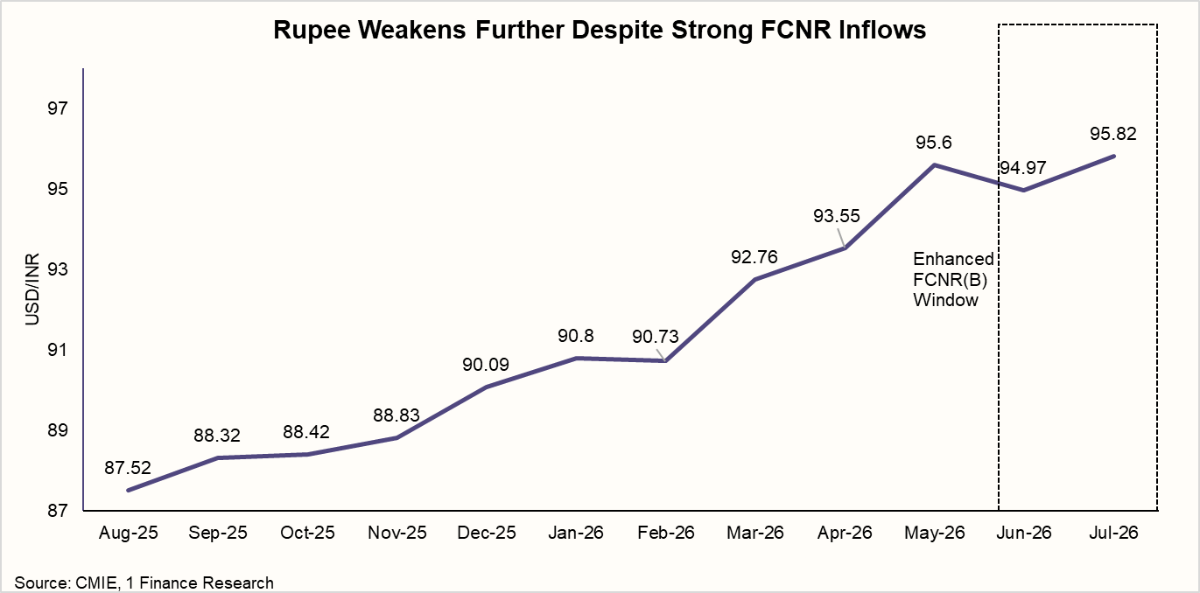
That is a different picture from the one carried in earlier drafts. The rupee did not weaken through the window. It weakened sharply before it, falling from around 89.86 in early January to the late-July low, and it has moved sideways since. Over twelve months, it is down roughly 10% against the dollar, and around 6% year to date.
The instinct is to read a $26 billion reserve build as the facility working on the currency. What actually happened is more useful than that. The inflows did not buy appreciation. What they appear to have bought is a floor.
That is consistent with a central bank prioritising buffer over level. A buffer protects against a disorderly move. Level defence burns reserves against a trend driven by the oil bill and the dollar, and rarely holds. On the evidence of the past ten weeks the RBI got what it was after. The slide has stopped, and the rupee has neither broken 97 nor recovered towards 94.
For advisors. Stop expecting the inflow story to produce rupee appreciation. Stability rather than strength is the realistic objective, and the currency stays sensitive to crude, the dollar and the external balance. The real test comes after 31 August, when the mobilisation window closes and the floor has to hold without new FCNR money behind it.
The Bond Market Is Where This Actually Shows Up
The 10-year G-sec rose 17 basis points through July to 6.85%, driven by Brent moving from $77 to $92 over the month, tight system liquidity, and the postponement of India's inclusion in Bloomberg's EM index. It has since eased to 6.76% as of 14 August. Short rates moved further in July: the 3-month CD yield rose 36 basis points to 6.80% and the 12-month CD to 7.10%.
The deposit build is the force now working the other way. ₹11 lakh crore of new deposits in three fortnights relieves the liquidity constraint that pushed short rates up through July, and it arrives at exactly the point where crude and the rupee are holding up the long end.
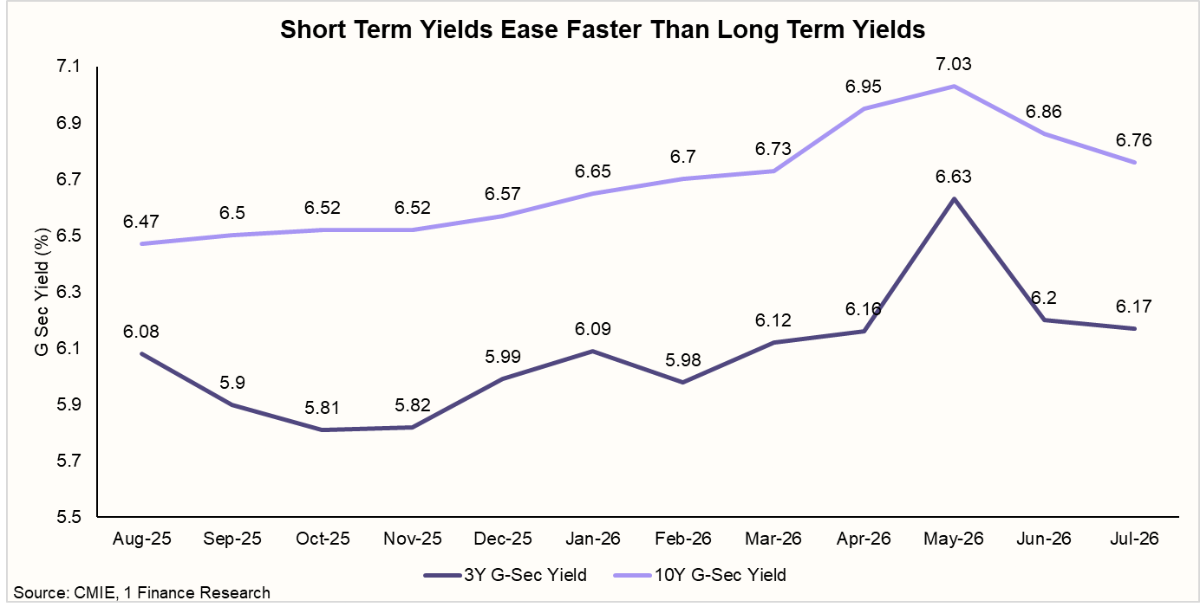
That leaves the curve pulled in two directions by the same policy. FCNR conversion is loosening the short end while the inflation and crude picture holds up the long end. Short rates respond quickly to liquidity operations and near-term repo expectations. The 10-year carries expectations about inflation, the future repo path, government borrowing and the risk premium investors demand, none of which the deposit surge touches.
For fixed income positioning, this argues for the short to medium end of the curve and against adding duration until the inflation path resolves. A sustained fall in inflation would strengthen the case for duration later. A renewed rise in crude, food inflation or borrowing would reverse the long end quickly.
Inflation Pressures Are Becoming Broader
July CPI came in at 4.45%, up from 4.38% in June and 3.93% in May. That is the ninth consecutive monthly increase and the highest reading since December 2024. Rural inflation at 4.84% is running well above urban at 3.96%.
| CPI Inflation Across Key Components | |||
|---|---|---|---|
| Inflation | May 2026 | June 2026 | July 2026 |
| CPI Headline | 3.93 | 4.38 | 4.45 |
| CPI Food | 4.78 | 5.32 | 5.52 |
| CPI Fuel | 1.73 | 2 | 2.16 |
| CPI Housing | 1.89 | 2.19 | 2.4 |
| CPI Transport | 1.75 | 4.32 | 4.43 |
| CPI Restaurants and Accommodation | 5.74 | 6.91 | 7.72 |
The pickup is no longer confined to food. Transport, restaurants and accommodation have seen the sharpest acceleration, both consistent with energy pass-through from the West Asia conflict, with the weaker rupee magnifying the imported component. Housing remains contained and fuel inflation, while rising, stays moderate.
The monsoon adds a second, food-specific channel. The IMD expects August rainfall below 94% of the long-period average as moderate El Niño conditions strengthen. The cumulative seasonal deficit stood at 11.5% below the long-period average on 1 August; live storage across 166 major reservoirs is at 44.39% of capacity, and planted area was trailing last year by 3.88 million hectares in late July. August carries roughly 29% of monsoon rainfall and 20% of kharif sowing, which is why a June shortfall can be recovered and an August one generally cannot.
With food and beverages carrying roughly 46% of the CPI basket, any shortfall in vegetable and cereal output runs straight to the headline number. Vegetables are the most exposed, since they cannot be stored through a supply disruption.
Growth remains strong enough for the RBI to stay patient. It projects FY27 GDP growth at 6.7%, with growth moderating to 6.4% in Q2 before recovering to 6.5% in Q3 and 6.8% in Q4. Private consumption, investment, bank credit and services remain supportive, though global uncertainty could weigh on activity. [VERIFY: those three quarters against a 6.7% full-year figure imply Q1 near 7.1%. Confirm against the MPC statement.]
Where the RBI Goes Next
The RBI held the repo rate at 5.25% and retained its neutral stance. Both the RBI and our own forecast see inflation peaking in Q3 FY27 before moderating. Where the two part company is what happens after the peak.
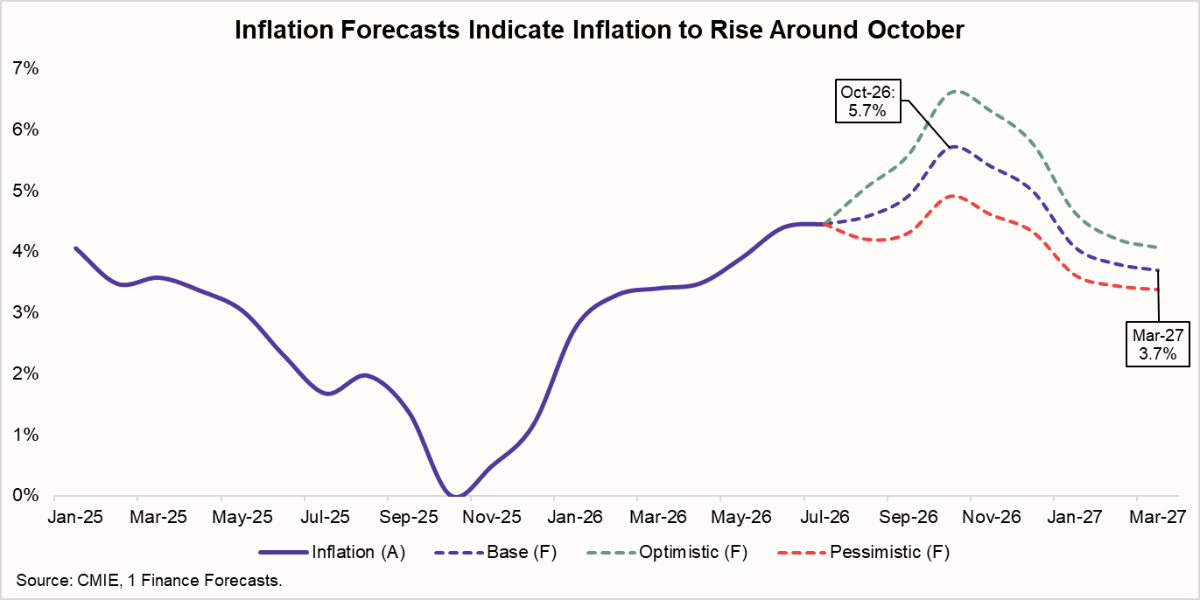
We agree with the RBI on the timing of the peak and disagree sharply on the descent. The RBI has Q4 at 5.5%; we have 3.9%. That 160 basis point gap is the most consequential number in this edition, because it is the difference between a policy rate that stays where it is and one that has room to fall by the end of the financial year.
| Next RBI Rate Decision Outlook | ||
|---|---|---|
| Outcome | Assessment | Reasoning |
| Extended pause | 🟢Highly Likely | The RBI wants confirmation that the Q3 peak is real before moving in either direction |
| Rate cut | 🔴Highly Unlikely | Requires the peak to hold and food inflation to break decisively, neither of which is confirmed |
| Rate hike | 🟠Unlikely | Would need the food and energy shock to persist. Two large houses now expect one from December |
The next MPC is likely to hold. Advisors should treat rate-sensitive sectors as being in a holding pattern, not as candidates for a near-term tailwind.
UPI Is a Policy Question, Not Yet an Earnings Question
The latest tax amendment removes the statutory reference to zero MDR and gives the Government flexibility to prescribe a Merchant Discount Rate on merchant UPI payments. MDR is the fee charged on a digital payment transaction, typically borne by the merchant and shared across the payment ecosystem. The Finance Minister has clarified that P2P payments will continue to remain free, which makes merchant transactions the area to watch.
The amendment itself sets no rate, no date and no revenue-sharing structure. It creates the option, not the revenue.
| UPI Merchant Discount Rates (MDR) Framework Changes | ||
|---|---|---|
| UPI MDR Framework | Earlier | New Framework |
| P2P payments | 0% MDR | No MDR |
| Merchant payments | 0% MDR | MDR could be introduced |
| Decision Making Authority | Fixed under existing law | Government notification |
| Immediate impact | No MDR revenue | Potential new revenue stream |
Why this matters is scale. UPI transaction volume rose 23.6% and value 19.9% between April to July 2025 and the same four months of 2026. At that size, even a small merchant fee compounds into a meaningful pool.
| UPI Transaction Growth Over The Past Year | |||
|---|---|---|---|
| UPI Metrics | Apr - Jul 2025 | Apr - Jul 2026 | Increase |
| Transaction volume | 74,379 lakh | 91,923 lakh | 23.6% |
| Transaction value | ₹98.2 lakh crore | ₹117.7 lakh crore | 19.9% |
| 💡With UPI transaction value already reaching ₹117.7 lakh crore in Apr - July 2026, even a modest 0.1% MDR on the eligible merchant transaction base could translate into a sizeable revenue pool of around ₹11,770 crore. This could create an additional revenue stream for the payments ecosystem and potentially reduce the Government's fiscal burden of supporting the zero-MDR framework, allowing public funds to be redirected towards other priorities. |
Large banks handle a substantial share of UPI value. SBI alone accounts for 26.8% of the value passing through the top 50 banks, with HDFC Bank at 10.5%.
| UPI Transaction Exposure Across Major Banks | |||
|---|---|---|---|
| Bank | UPI Transaction Value (₹ Cr) (May 2026) | Share of Top 50 Value | Relative MDR Exposure |
| SBI | 7,51,094 | 26.8% | Very High |
| HDFC Bank | 2,95,947 | 10.5% | Very High |
| Bank of Baroda | 1,74,040 | 6.2% | High |
| Union Bank of India | 1,65,510 | 5.9% | Moderate |
| Axis Bank | 1,48,855 | 5.3% | Moderate |
| Canara Bank | 1,41,293 | 5.0% | Moderate |
| Punjab National Bank | 1,41,068 | 5.0% | Moderate |
| ICICI Bank | 1,35,656 | 4.8% | Low |
| Kotak Mahindra Bank | 1,06,768 | 3.8% | Low |
| Bank of India | 84,269 | 3.0% | Low |
Transaction value indicates scale rather than fee entitlement. MDR accrues on the acquiring side of a transaction, and PhonePe, Google Pay and Paytm handle the bulk of merchant acquiring in India. A bank's position in this table is therefore a starting point for assessing exposure, not a proxy for the revenue it would earn.
For investors, the amendment creates an earnings opportunity rather than an earnings story. The move could also ease the fiscal cost of supporting zero MDR as volumes continue to expand. The size and timing of any benefit depend on the rate, the eligible P2M base and the revenue-sharing structure, none of which has been specified.
The Government notification naming the eligible payment modes is the trigger. Until it lands, there is nothing here to price. Even after it does, the financial impact would only become visible several quarters into implementation, once transaction data reflects the new framework.
What It Means for Advisors and Investors
This is not a broad risk-on setup. Improving liquidity, a contested rate path and a policy development with option value point towards selective positioning rather than directional exposure.
| Theme | What to Look For |
|---|---|
| FCNR inflows and bank funding | The deposit build is a real and immediate positive on funding cost. Favour banks with strong credit growth and healthy balance sheets. This benefit is independent of anything MDR does later. |
| Fixed Income | Short- to medium-end of the curve. Hold off on duration until the inflation path resolves. |
| UPI and payments | Banks and payment companies with high P2M acquiring exposure carry the optionality. Do not price the benefit before the notification. |
| RBI repo rate | Banks, NBFCs, autos and real estate are in a holding pattern. Do not position for an easing cycle that consensus is currently pricing in the opposite direction. |
| Rupee | Exporters and dollar-revenue businesses retain the advantage. Import-heavy manufacturers carry the margin risk. The inflow story does not change this. |
The macro picture is shifting, but not uniformly. Liquidity is improving, UPI is moving towards monetisation, and inflation may eventually create room for rate cuts, while the rupee, crude and food inflation remain key risks. For investors, the opportunity lies in selective positioning around these trends, with earnings visibility and valuation discipline remaining critical.