India's real GDP grew 7.7% in FY26 and 7.8% year on year in Q1 FY27 (April to June 2026). Real per capita net national income (NNI) rose 21.3% between FY23 and FY26.
Strong growth and a middle class squeeze can coexist. GDP measures total output. How a household fares depends on how that output is shared, the prices it pays, and how much it saves or borrows.
The official data points to pressure in four places. Employees took 34.9% of registered factory value added in FY25, against 40.6% in FY20. Real pay for regular salaried workers rose only about 4% between CY2023 and CY2025. Household borrowing jumped in FY23 and FY24 and is accelerating again. And taxes on income from individuals and other non-corporate taxpayers have exceeded corporation tax since FY23.
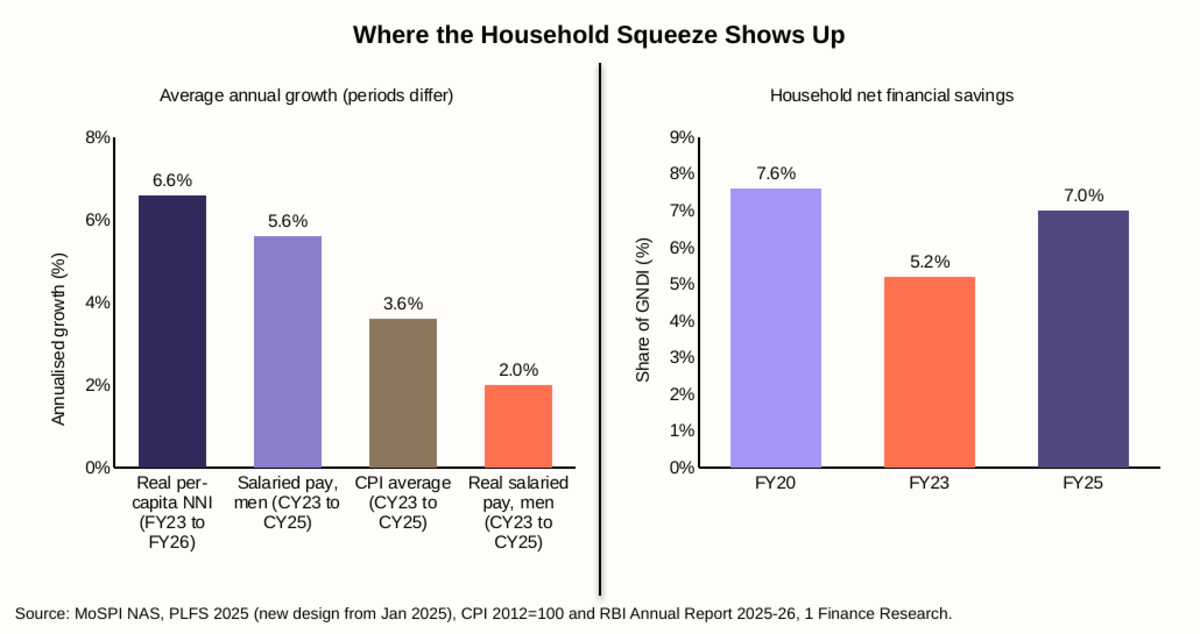
Note: Left panel shows compound annual growth over the periods labelled, on a calendar-year basis for salaried pay and CPI and a financial-year basis otherwise. PLFS changed its sampling design in January 2025.
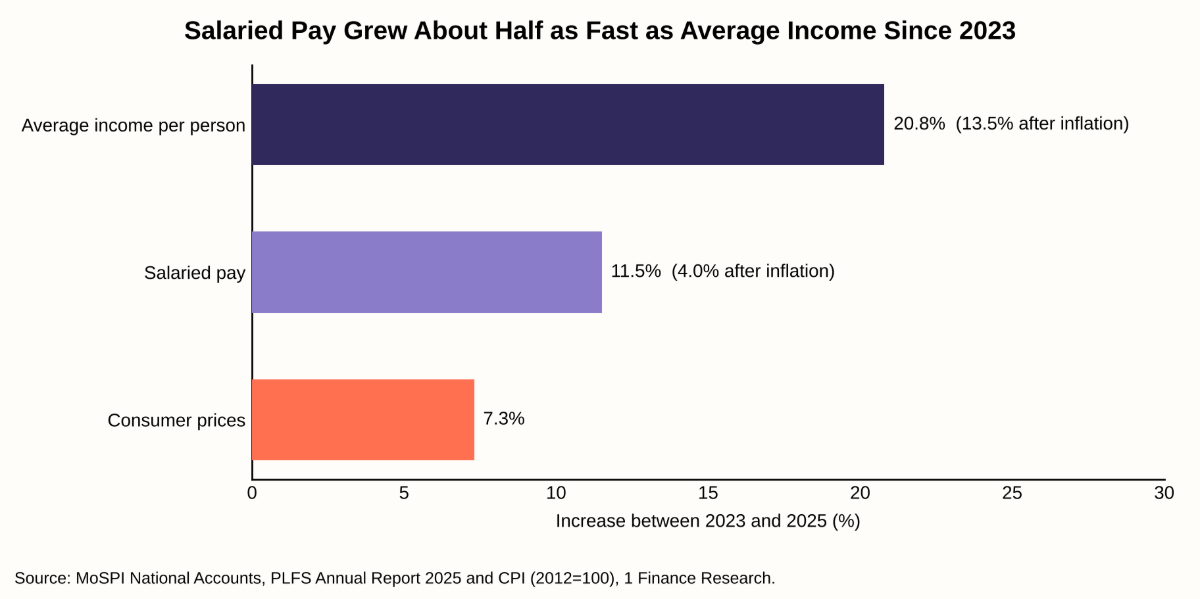
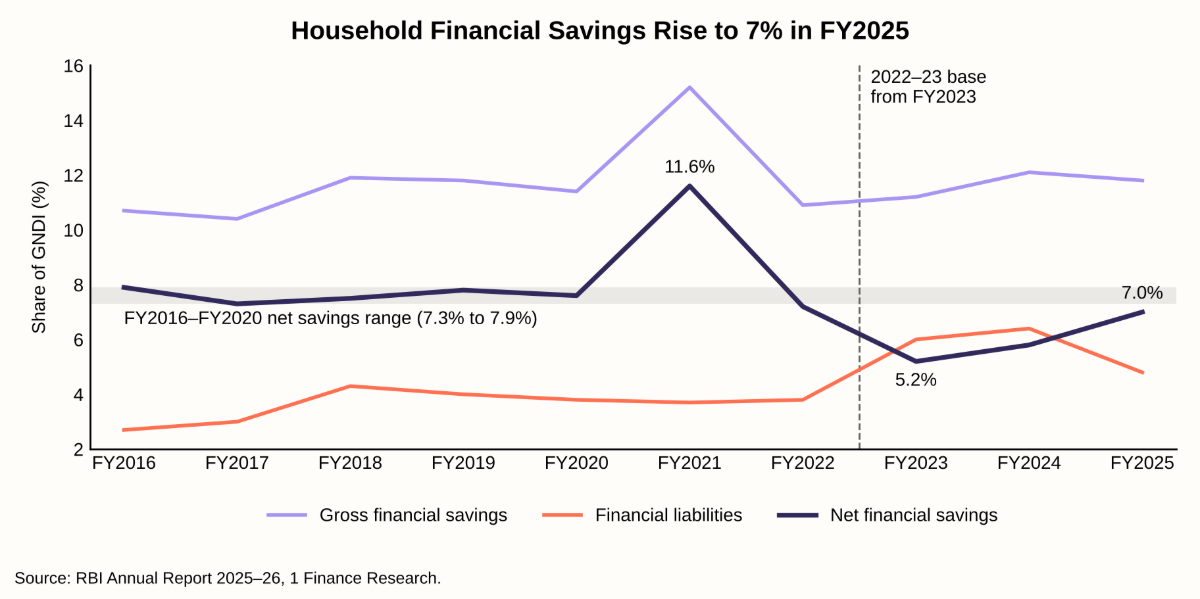
The left panel shows the gap. Average income includes company profits and self-employment earnings, while salaried pay rose about 2% a year after inflation. The right panel shows how households coped. Net financial savings fell from 7.6% of gross national disposable income (GNDI) in FY20 to 5.2% in FY23 as borrowing rose, then recovered to 7.0% in FY25.
Where India's Urban Spending Middle Sits
India has no official definition of the middle class. MoSPI's Household Consumption Expenditure Survey (HCES) 2023-24 instead ranks households by monthly per capita consumption expenditure (MPCE), what a household spends per person each month.
| Urban Spending by Percentile Band in 2023-24 | ||
|---|---|---|
| Urban MPCE band | Average MPCE (₹ per person per month) | Four-person household, illustrative (₹ per month) |
| 40th to 50th | 5,622 | 22,488 |
| 50th to 60th | 6,334 | 25,336 |
| 60th to 70th | 7,199 | 28,796 |
| 70th to 80th | 8,353 | 33,412 |
| 80th to 90th | 10,139 | 40,556 |
| 90th to 95th | 12,817 | 51,268 |
Note: The percentile range is a 1 Finance reading of HCES, not an official definition. Family figures multiply MPCE by four.
The urban middle spans roughly the 40th to 95th percentiles. The statistical middle, the 40th to 60th, spends about ₹22,500 to ₹25,300 a month for a family of four. The top 5% spends far more and lifts the urban average to ₹6,996 per person, above what the statistical middle spends. Salaried families who call themselves middle class usually sit higher, at ₹28,800 to ₹51,300, which is why averages feel distant from their budgets.
Salaried workers are also a minority, 23.6% of all workers in CY2025 according to PLFS. Their finances turn on pay settlements, EMIs and tax deducted at source, so changes in pay, prices, interest rates and tax hit them directly.
India's GDP Growth Stays Strong at 7.7% in FY26
India's economy has kept growing quickly. Real GDP grew 7.2% in FY24, 7.1% in FY25 and 7.7% in FY26 on MoSPI's new 2022-23 base, and 7.8% in Q1 FY27.
Households drove the FY26 pickup. Real private consumption grew 7.7%, after 5.8% in each of the two previous years, helped by the April 2025 income tax cut, lower GST rates from 22 September 2025 and a repo rate cut to 5.25%. Some of the extra spending was borrowed.
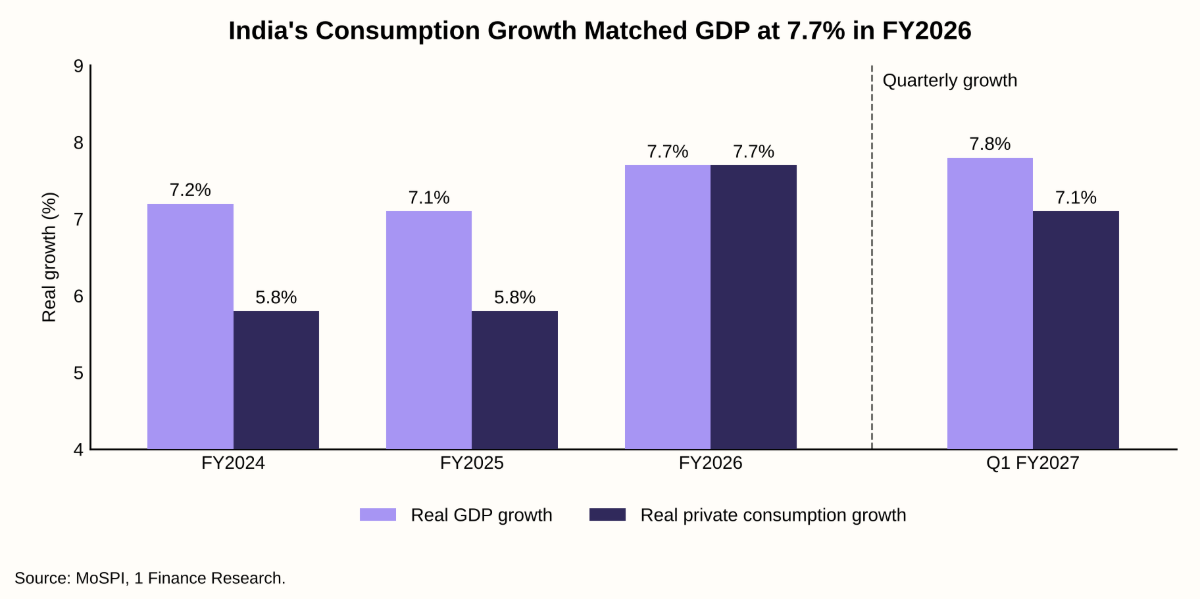
Note: Real growth on MoSPI's 2022-23 base. FY26 figures are provisional estimates released on 5 June 2026.
Average income rose too. Real per capita NNI rose from ₹1,59,557 in FY23 to ₹1,93,480 in FY26, about 6.6% a year. But an average shows how big the pie is, not who gets which slice.
Factory Value Added Has Outgrown Employee Pay
MoSPI's Annual Survey of Industries (ASI) shows how income in registered factories is split. Between FY20 and FY25, net value added (NVA) rose 89.7%, from ₹12.13 lakh crore to ₹23.00 lakh crore, while total emoluments (wages, salaries, bonuses and some benefits) rose 63.3%, from ₹4.92 lakh crore to ₹8.03 lakh crore.
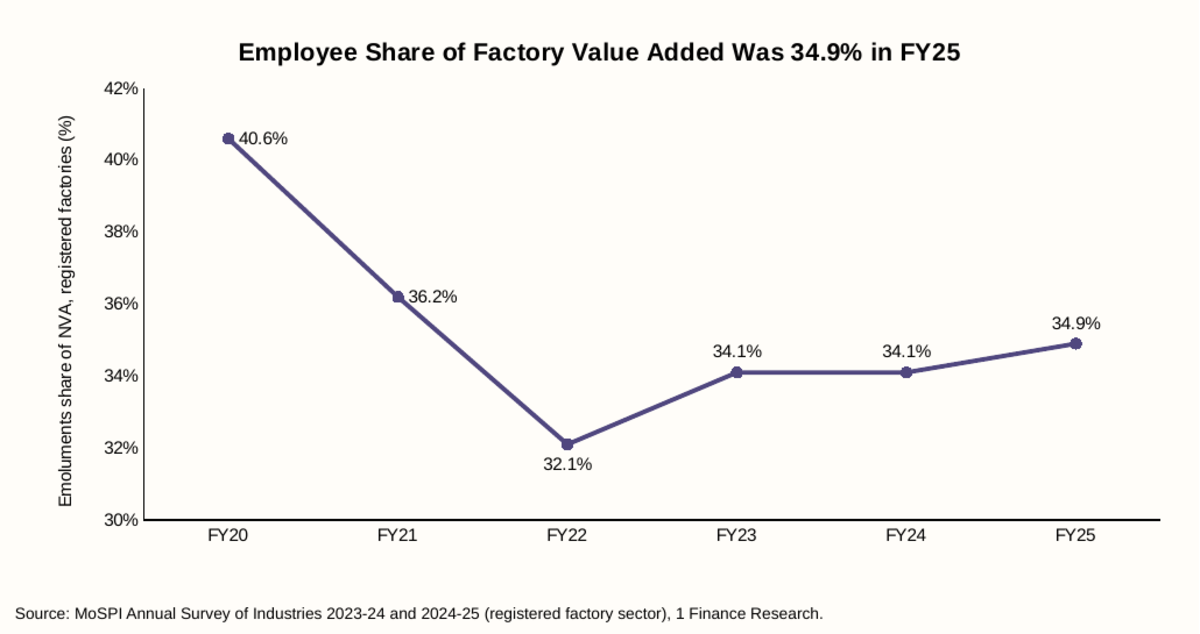
The pandemic drove the drop. In FY21, factory employment fell 3.2% and emoluments fell 1.6%, while NVA still rose 10.2%. In FY22, NVA jumped 30.9% as demand and output prices rebounded, but pay rose only 15.9%, pushing the employee share to a low of 32.1%. The share has since edged back to 34.9% in FY25, as emoluments grew 12.1% against NVA growth of about 9.4%, but it remains 5.6 percentage points below FY20. Since NVA also covers interest and rent, this shows value added outgrowing pay, not profits outgrowing pay rupee for rupee.
Salaried Pay in India Has Lagged Behind Average Income
Between 2023 and 2025, average income per person in India rose about 21%. Salaried pay rose 11.5%, for men and women alike, closer to the 7.3% rise in prices than to the growth of the economy.
Note: Average income per person is MoSPI's per capita NNI for FY23 to FY25. Salaried pay is PLFS average monthly earnings of regular salaried employees for calendar 2023 to 2025. Prices are the calendar-year average CPI (2012=100), calculated by 1 Finance Research. The periods overlap but do not match exactly.
The gap is about who earns the income. Average income counts company profits, rent, interest and self-employment earnings, and PLFS shows self-employed earnings rose 14% to 18% over the same two years. Salaried pay moves only with annual increments. After inflation, real income per person rose 13.5%, while real salaried pay rose about 4%.
Even that 4% was mostly luck. Pay growth was steady, but inflation fell from 4.9% in 2024 to 2.2% in 2025 as food became cheaper, and in October 2025 food prices were 5.0% lower than a year earlier. In 2024, when prices rose faster, salaried pay barely kept up. With headline inflation back at 5.54% in September 2026, real pay growth at 2025's pace of raises would fall below 2% a year, leaving less room to save and more reason to borrow.
Household Savings in India Have Recovered Only Partly
The squeeze shows most clearly in what households save and what they borrow.
Note: RBI Annual Report 2025-26, Table II.2.2, in per cent of gross national disposable income (GNDI). Data from FY23 onward are on the 2022-23 base, so the move from FY22 to FY23 crosses a series break. The shaded band marks the FY16 to FY20 range of net savings.
The FY21 jump in savings was forced, as lockdowns lifted net financial savings to 11.6% of GNDI. Once spending resumed, households borrowed heavily. New liabilities rose from 3.8% of GNDI in FY22 to 6.4% in FY24, and net savings fell to 5.2% in FY23, the lowest in the RBI's ten-year table.
Borrowing eased in FY25, following the RBI's November 2023 increase in the risk weight on unsecured consumer loans from 100% to 125%, and on credit card receivables from 125% to 150%. Housing, education, vehicle and gold loans were excluded. Bank personal loan growth slowed to 14.0% in March 2025 from 17.6% a year earlier. Liabilities fell to 4.8% of GNDI and net savings rose to 7.0%. Is that good news? Yes, with limits. The gain came from borrowing less, not saving more, as gross savings slipped from 12.1% of GNDI to 11.8%. Net savings also remain below the 7.3% to 7.9% range of FY16 to FY20.
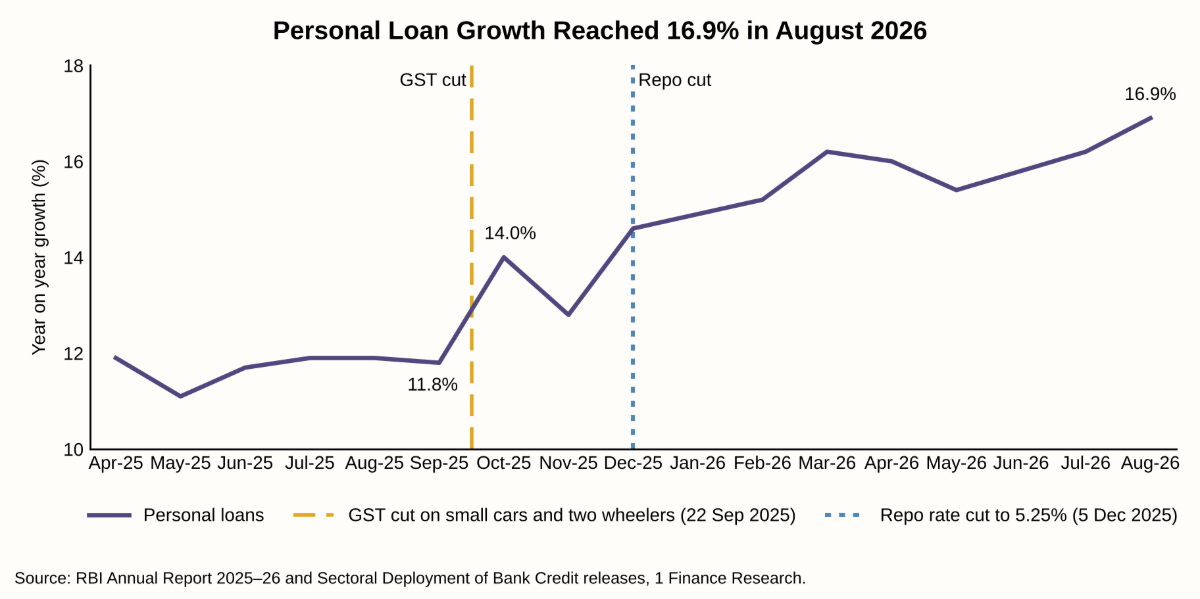
Borrowing turned up again from October 2025. Personal loan growth jumped from 11.8% in September to 14.0% in October, the first full month after GST on small cars and two-wheelers fell from 28% to 18%. The RBI had also cut the repo rate by 125 basis points during 2025, to 5.25%. Personal loan growth reached 16.9% in August 2026.
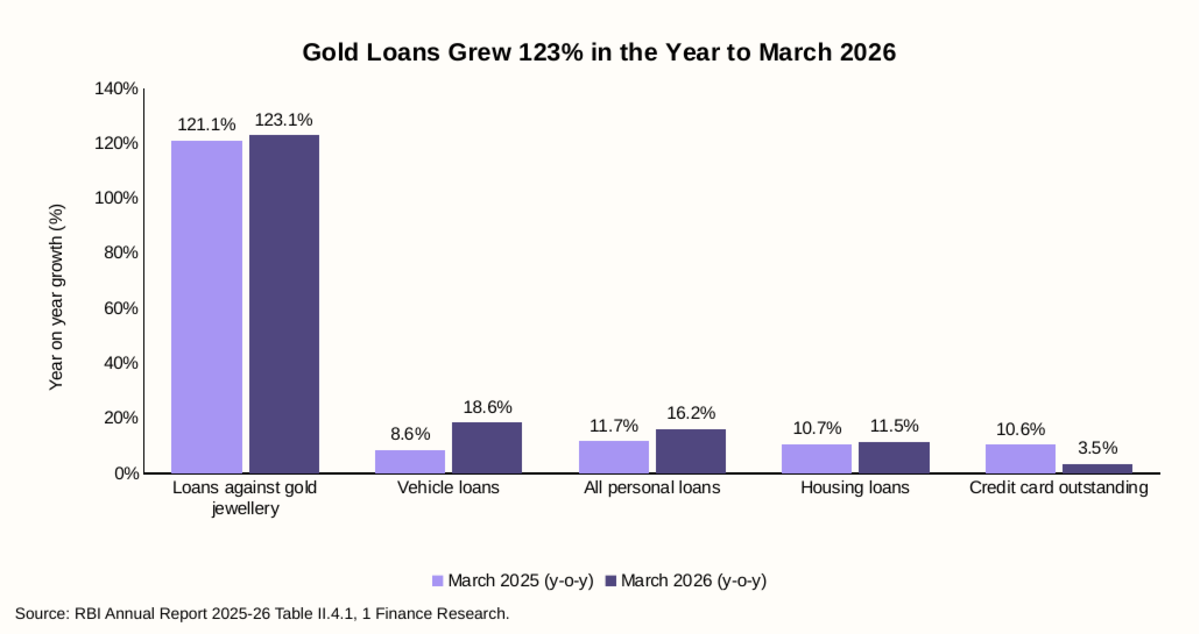
Gold loans grew fastest. They were exempt from the 2023 risk-weight increase, and in June 2025 the RBI raised the loan-to-value limit on gold loans under ₹2.5 lakh from 75% to 85%. Credit card growth slowed from 10.6% to 3.5%. The RBI's December 2025 Financial Stability Report put household debt at 41.3% of GDP in March 2025, above its five-year average of 38.3%, though it judged household finances sound overall.
Cost of Living in India Rises Unevenly
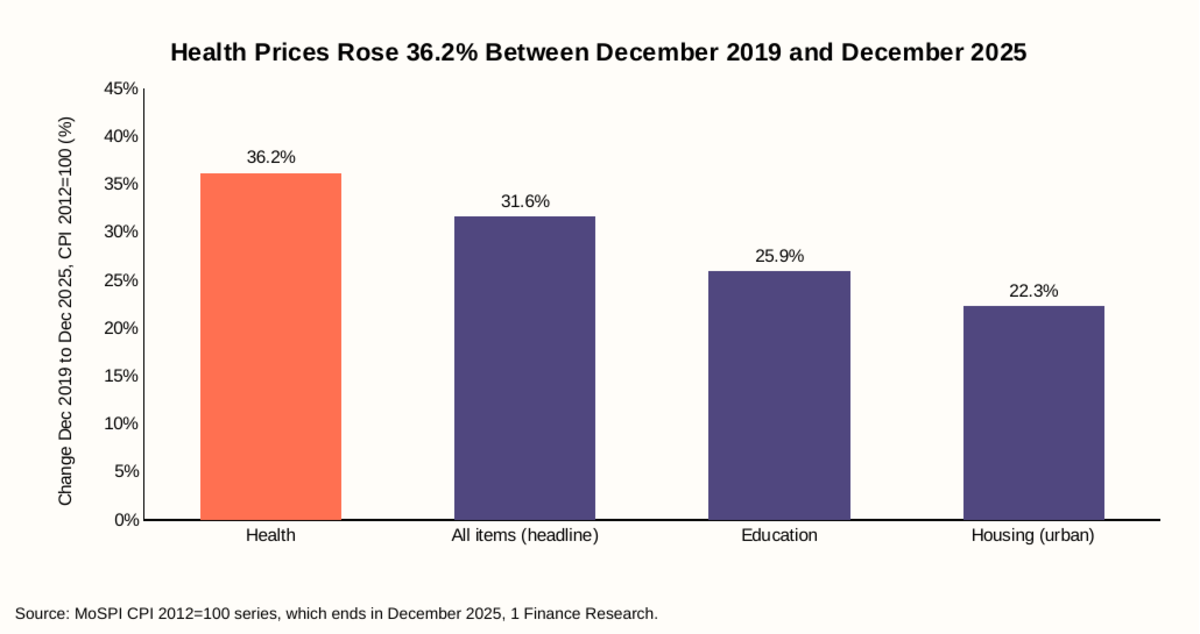
Note: The 2012=100 series ends in December 2025. The new 2024=100 series uses different categories, so group readings are not like for like.
Health outran inflation from 2019 to 2025. The CPI health index rose 36.2%, against 31.6% for the overall index, because doctor fees and hospital charges do not fall when food prices do. Education (25.9%) and urban housing (22.3%) rose more slowly, though the education index can understate private school fees.
| Category Inflation in December 2025 and August 2026 | ||
|---|---|---|
| Category | December 2025, CPI 2012=100 (% y-o-y) | August 2026, CPI 2024=100 (% y-o-y) |
| Headline CPI | 1.33 | 4.82 |
| Food | -1.8 (food and beverages index) | 5.95 (consumer food price index) |
| Health | 3.43 | 1.34 |
| Education | 3.32 | 3.73 |
Note: Different series, weights and food measures, so compare direction within each column.
The pattern has since flipped. Headline inflation rose to 4.82% in August 2026 as food inflation returned to 5.95%, while health inflation cooled to 1.34% after the September 2025 GST cut on most medicines from 12% to 5%, with 33 lifesaving drugs exempted.
House prices tell a different story. RBI's 18-city House Price Index rose 15.9% from FY23 to Q4 FY26, slower than the 30.4% rise in nominal income per person, though salaried pay grew more slowly than that average.
💡What This Looks Like in Practice A salaried man earning ₹21,717 a month in CY2023 earned ₹24,217 in CY2025, a rise of ₹2,500. To keep pace with prices he needed ₹23,293, so his real gain is about ₹924 a month. Health spending that cost ₹10,000 in December 2019 cost ₹13,617 by December 2025, against ₹13,165 at headline inflation. Planning on headline CPI alone would have left a shortfall of about ₹452 for every ₹10,000. |
Note: Worked example using MoSPI averages for regular salaried men (PLFS) and CPI index changes.
Taxes on Income Now Exceed Corporation Tax
Since FY23, the Union government has collected more from taxes on income, paid mainly by individuals, than from corporation tax. The lead reached ₹2.48 lakh crore in FY25.
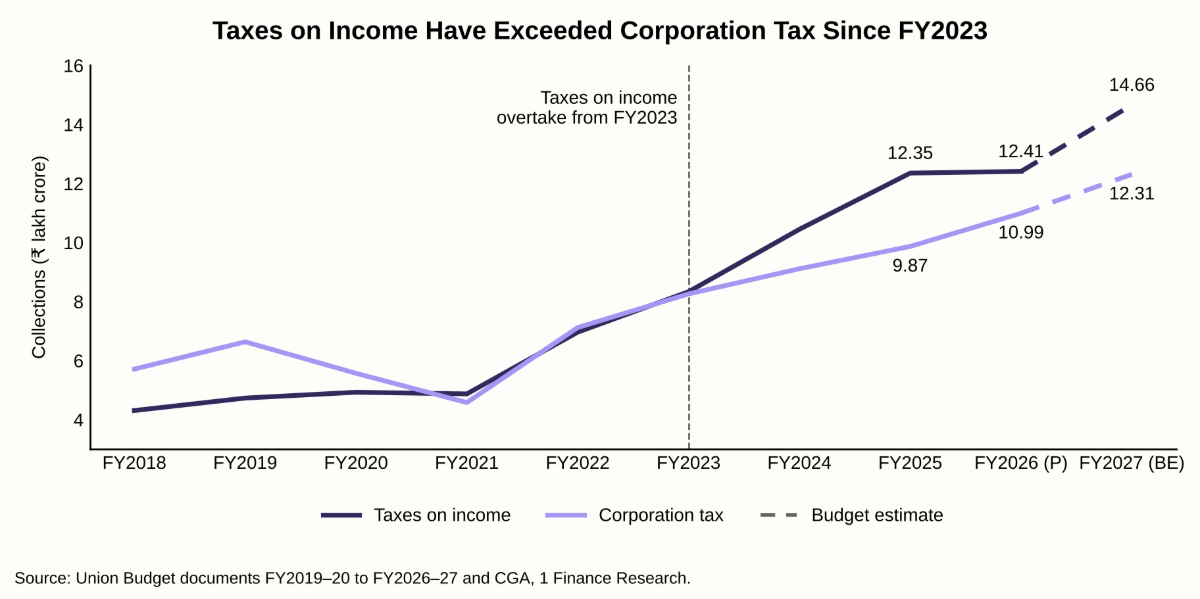
Note: Taxes on income is the Union Budget head for non-corporate income tax and includes Securities Transaction Tax (STT). FY2026 is provisional and FY2027 a budget estimate.
Two events reversed the order. After the base corporate tax rate was cut to 22% in September 2019, corporation tax fell from ₹6.64 lakh crore in FY19 to ₹4.58 lakh crore in FY21. Taxes on income rose from ₹4.87 lakh crore to ₹12.35 lakh crore between FY21 and FY25.
The lead narrowed in FY26, the first year of the Budget 2025-26 tax cut. Provisional accounts show taxes on income up just 0.5% at ₹12.41 lakh crore, short of the revised estimate of ₹13.12 lakh crore, while corporation tax rose 11.4% to ₹10.99 lakh crore.
| Income Tax Before and After Budget 2025-26 at Six Income Levels | |||||
|---|---|---|---|---|---|
| Taxable income | Tax before (₹) | Tax now (₹) | Saving (₹) | Effective tax rate before (%) | Effective tax rate now (%) |
| ₹7 lakh | 0 | 0 | 0 | 0.0 | 0.0 |
| ₹10 lakh | 50,000 | 0 | 50,000 | 5.0 | 0.0 |
| ₹12 lakh | 80,000 | 0 | 80,000 | 6.7 | 0.0 |
| ₹18 lakh | 2,30,000 | 1,60,000 | 70,000 | 12.8 | 8.9 |
| ₹25 lakh | 4,40,000 | 3,30,000 | 1,10,000 | 17.6 | 13.2 |
| ₹50 lakh | 11,90,000 | 10,80,000 | 1,10,000 | 23.8 | 21.6 |
Note: New regime, excluding cess and surcharge. Calculated by 1 Finance Research from the FY2024-25 and FY2025-26 slabs; savings at ₹12 lakh, ₹18 lakh and ₹25 lakh match the Budget Speech. Salaried taxpayers can add the ₹75,000 standard deduction.
The cut was deepest at ₹10 lakh to ₹12 lakh, where tax fell to zero, a saving of 5.0% to 6.7% of income. Higher up, the saving is smaller as a share of income and stops at ₹1,10,000 above ₹24 lakh, and at ₹7 lakh nothing changed because tax was already zero.
In FY27 so far, individuals still pay more, but corporate tax is growing faster.
| Net Direct Tax Collections From 1 April to 14 October | |||
|---|---|---|---|
| Tax | 2025 (₹ lakh crore) | 2026 (₹ lakh crore) | Growth (%) |
| Non-corporate tax | 6.54 | 6.92 | 5.8 |
| Corporate tax | 4.97 | 5.99 | 20.6 |
| Lead of non-corporate tax | 1.57 | 0.93 | |
Note: Net of refunds. Non-corporate tax covers individuals, HUFs, firms and other non-company taxpayers and excludes STT, so it is lower than the Budget's taxes on income. Growth and lead calculated by 1 Finance Research.
Refunds to non-corporate taxpayers rose 67%, holding down net growth. Budget 2026-27 left the slabs unchanged and expects taxes on income of ₹14.66 lakh crore in FY27, ₹2.35 lakh crore more than corporation tax.
Is the Middle Class Squeeze Real?
The pressure is real but uneven. Consumption, savings and the factory employee share have all improved recently, and tax relief put money back in pockets. But salaried pay has grown about half as fast as average income, most of its real gain came from a one-off fall in food prices, household debt sits above its recent average, and borrowing is accelerating again. Aggregate growth has been strong, but salaried households have seen slower real pay gains, a savings cushion that has only partly recovered, and a return to faster borrowing. The squeeze is about balance sheets and cash flow more than any single year's inflation.
What This Means for Investors and Advisors
- Repay costly debt before investing more. A personal loan charging more than equity can reasonably return is a guaranteed loss, so prepaying it comes before a new SIP. Personal loan growth of 16.9% in August 2026 shows how many households now carry such loans.
- Keep SIPs running, and step them up with real raises. Do not pause SIPs to service EMIs. When pay rises, add the part above inflation to the SIP.
- Check the real return on fixed income. With the repo rate at 5.50% and inflation rising, a new fixed deposit earns little after inflation and tax. Spread debt holdings across tenors.
- Run health goals as a separate bucket. Health prices rose about 5.3% a year from 2019 to 2025, faster than headline CPI. Fund that goal at the higher rate and back it with health cover.
- Choose tax saving products on merit. Under the new regime, most salaried taxpayers no longer need Section 80C deductions. Keep ELSS, PPF or NPS only where returns, lock in and liquidity suit the goal.
Conclusion
GDP tells you the economy is growing. Household data tells you who is carrying the cost. Factory value added has outgrown employee pay, salaried pay has lagged average income, and households borrowed heavily before tighter RBI rules slowed them. Tax relief and cheaper food helped in 2025, but inflation has returned and borrowing is rising again. Until salaried pay grows faster, many households will keep feeling squeezed.