In April to June 2026, Indians bought 15.4% less gold jewellery by weight than a year earlier, yet spent 34.4% more on it. The rupees households spend are not the same as the goods they take home, and neither is the same as what businesses keep.
India's festive economy is not one week of Diwali shopping. It is a year-long cycle of harvest festivals, religious holidays and weddings. Each sets off the same chain. Factories plan output, distributors fill warehouses, shops stock shelves, households spend, and the money spreads to workers, lenders, suppliers and the government.
The 2026 run-up to Diwali, which falls on 8 November, shows that chain at work. Factories' raw material inventory rose to 25.5% of sales by June, car dealers held 43 to 45 days of stock, twice the recommended level, and bank credit to services grew 28.3%. Yet retail inflation reached 5.54% in September, and Maruti Suzuki's net profit fell 26.9% even as its net sales rose 26.1%.
Household Spending and India's GDP
Festive demand matters because households drive most of India's economy. Private final consumption expenditure, which measures what households spend on goods and services, made up more than half of GDP in April to June 2026, according to MoSPI.
| Household Spending and Economic Growth | |
|---|---|
| Indicator | Value |
| Real GDP growth, April to June 2026 | 7.8%, up from 6.9% a year earlier |
| Real private consumption growth | 7.1%, up from 6.8% a year earlier |
| Private consumption, current prices | ₹49,08,179 crore |
| GDP, current prices | ₹88,26,871 crore |
| Private consumption share of GDP | 55.6% |
Note: Real figures remove the effect of price changes. Current price figures include it.
Households spent about ₹56 of every ₹100 the economy produced in April to June 2026. That is why a strong or weak festive season can move national growth.
Household spending also grew faster than it did a year earlier. The quarter that includes Diwali, October to December 2026, will appear in MoSPI's GDP data around the end of February 2027. Data for July to September 2026, when shops and factories stock up, is due at the end of November.
How Manufacturers Prepare for Festive Demand
Manufacturers plan festive output months in advance. They forecast demand, order raw materials, schedule production and build finished stock so that goods reach distributors before the season starts.
The RBI's Order Books, Inventories and Capacity Utilisation Survey (OBICUS) tracks one part of this. It measures inventory as a share of sales, so a higher ratio means more stock relative to what is being sold.
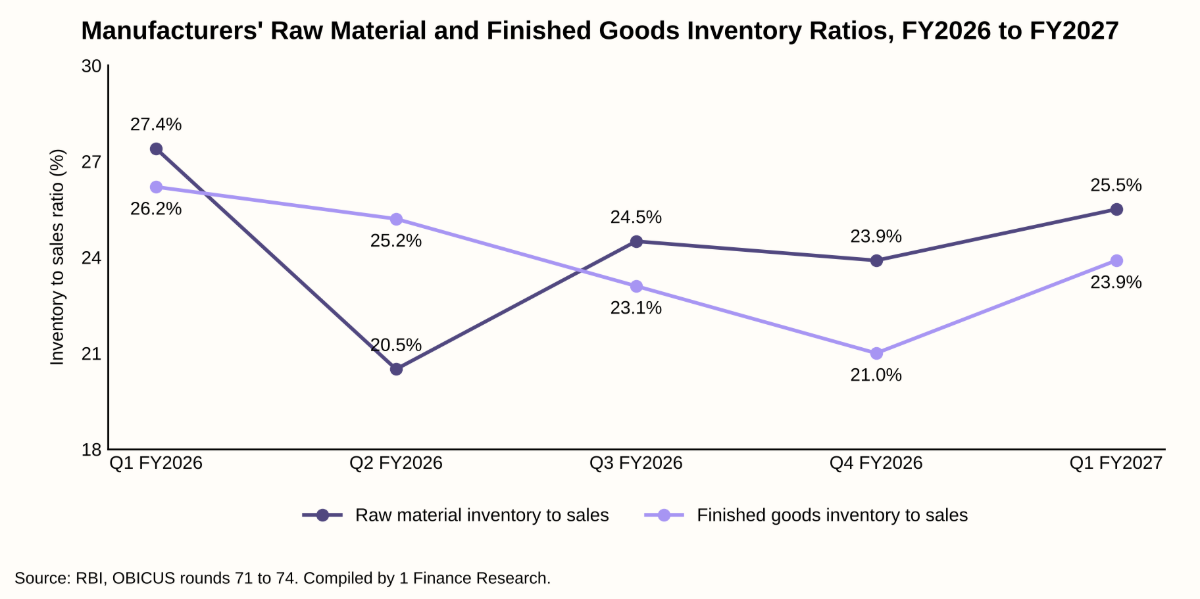
In July to September 2025, the raw material ratio fell to 20.5% as factories used up inputs ahead of last year's festivals. By April to June 2026, it had recovered to 25.5%, and the finished goods ratio stood at 23.9%. That is consistent with preparation for a busy second half, though the survey cannot show how much of it is for festivals.
The RBI's Industrial Outlook Survey asks 1,224 manufacturers whether they expect production and orders to rise or fall. Its score, called the net response, is the share of firms expecting a rise minus the share expecting a fall. If 55% expect a rise and 9% expect a fall, the score is 46.
For October to December 2026, the production score is 46.0 and the order book score is 45.0. Firms expecting more work far outnumber those expecting less.
Wholesalers, Distributors and Credit
Between the factory and the shop sits a layer most shoppers never see. Wholesalers and distributors buy in bulk, store goods in regional warehouses, break them into smaller lots and deliver them to thousands of retailers. They often buy on credit from manufacturers and give credit to shops in turn.
Before a festival, this layer holds stock that is already paid for, or owed, but not yet sold. Transport, warehousing and interest costs build up every day the goods wait. That makes credit central to how the chain works.
Manufacturers can also push too much stock into this layer. In August 2026, the Federation of Automobile Dealers Associations (FADA) urged carmakers to bill dealers strictly in line with retail sales, a sign that stock was moving into showrooms faster than it was selling.
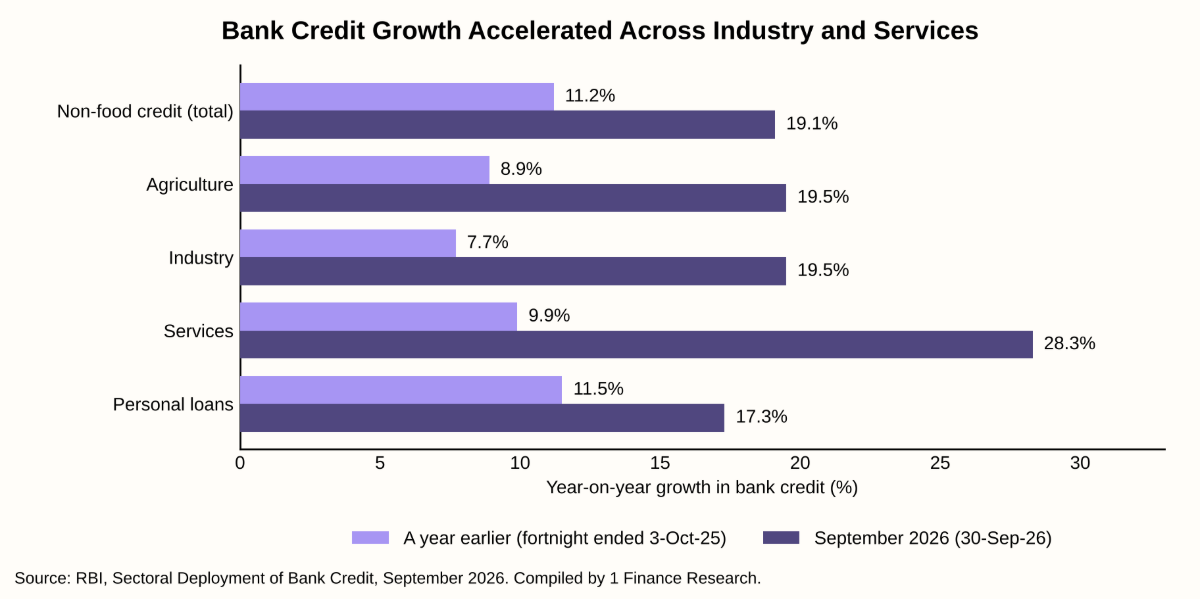
Bank credit to services grew 28.3%, against 9.9% a year earlier, and credit to industry grew 19.5%, against 7.7%. Services includes trade, but also transport, finance, real estate and other activities, so these numbers do not measure festive inventory loans. They do show that businesses across the economy are borrowing far more than a year ago. More credit can fund stock and growth, but it also raises the cost of anything that does not sell.
How Retailers Turn Inventory Into Sales
Retailers are where stock finally meets the customer. Each shop decides what to order, how much to hold and how deeply to discount. Bank offers, exchange deals and free gifts can lift sales but cut into margins. Online marketplaces and quick-commerce apps compete for the same purchases with sale events and fast delivery, which means placing stock in warehouses near customers before the rush.
Vehicle dealers offer the clearest data on this layer. FADA measures retail sales through vehicle registrations on the government's Vahan system and surveys dealers on their stock.
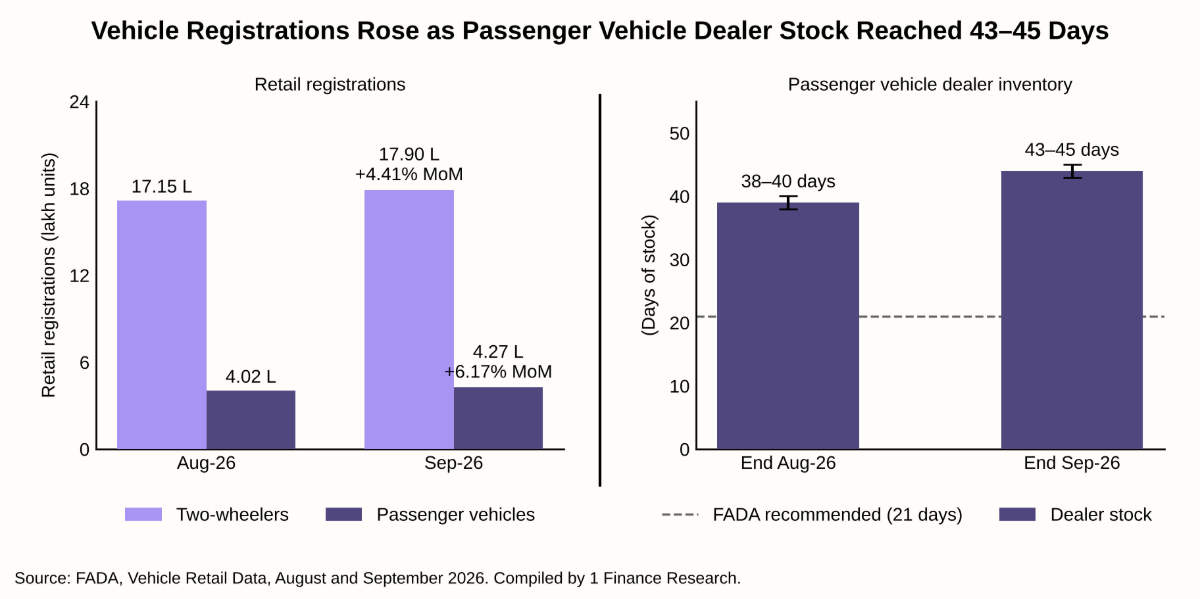
Registrations across all vehicle types reached 25,36,920 in September 2026, up 4.69% from August. FADA called it the best-ever September. The 31.82% rise from a year earlier is distorted, FADA warns, because many buyers delayed purchases in September 2025 until the GST cut took effect on 22 September.
Stock is the bigger story. Passenger vehicle dealers held 43 to 45 days of stock, about double the recommended level, and 60% said they had stocked up for the festivals. Maruti Suzuki, by contrast, reported only about 17 days of stock across its network and around 2 lakh pending bookings.
How Indian Households Spend and Pay
Festive shopping sits on top of a normal monthly budget. MoSPI's Household Consumption Expenditure Survey, covering August 2023 to July 2024, is the latest official picture of that budget. It is not a festive spending survey, but it shows how much room households have.
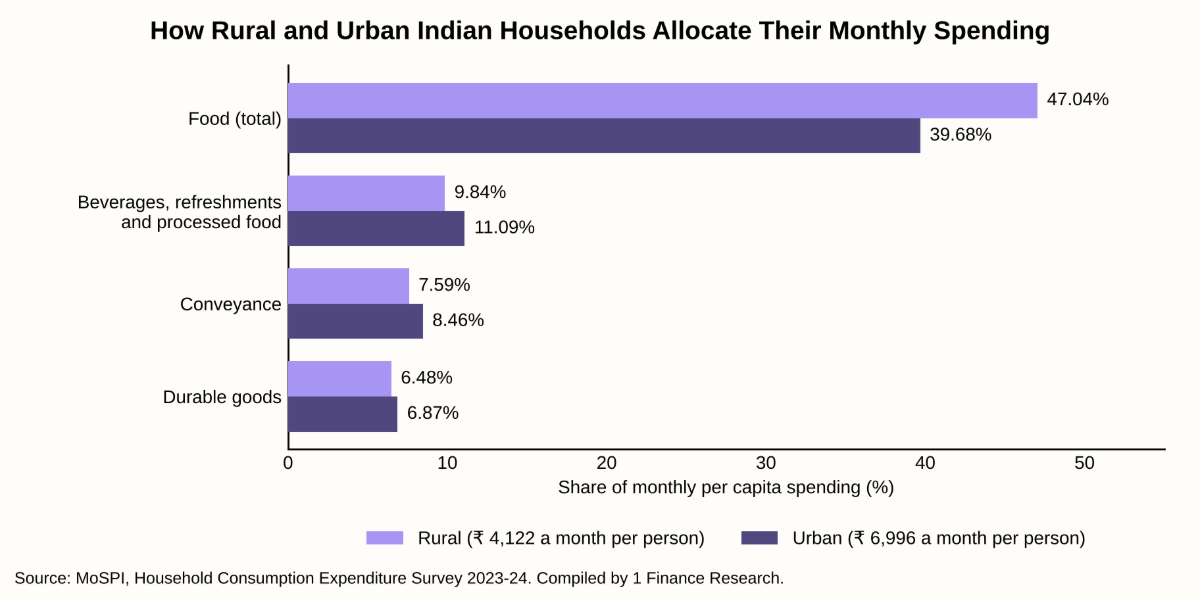
The average rural person spent ₹4,122 a month and the average urban person ₹6,996. Food took 47.04% of rural and 39.68% of urban spending. Conveyance (travel and fuel) and durable goods (such as vehicles and appliances) took about 14% of rural and 15% of urban budgets.
UPI handled ₹29.37 lakh crore in September 2026, 18% more than a year earlier, according to the RBI. That includes bills and transfers, so it measures payment activity, not festive shopping. Currency in circulation was ₹43,05,905 crore on 30 September 2026, up 13.3% on the year.
Where Festive Spending Goes
When you pay for a festive purchase, the money does not stay with the shop. It moves back along the chain, and every stage takes a share to cover its costs before anything is left as profit.
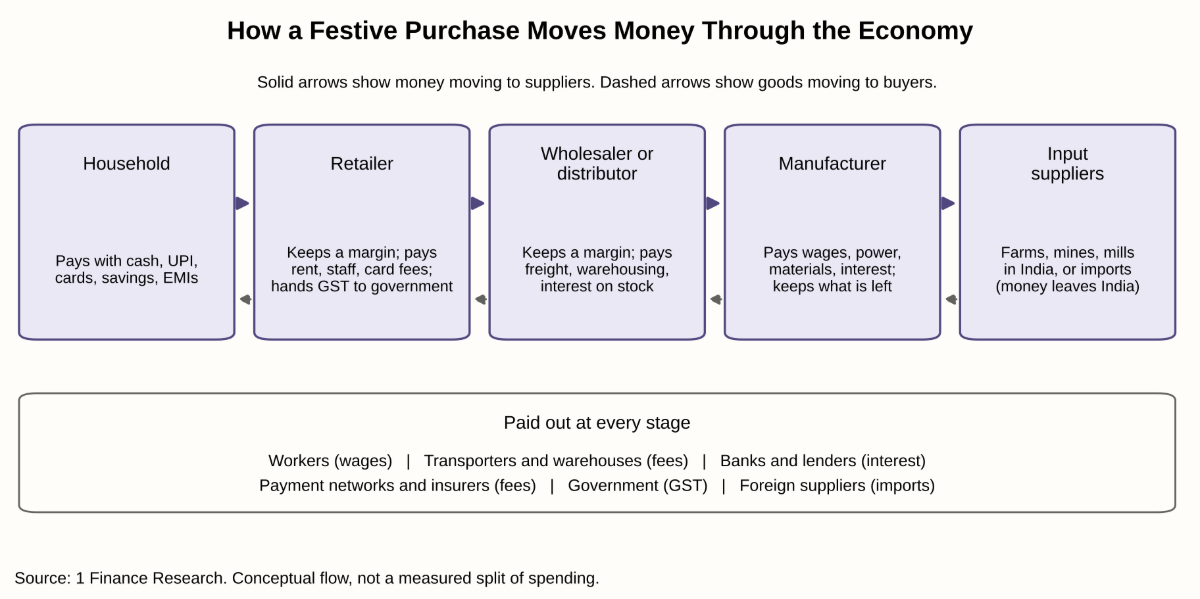
Take a television bought for ₹50,000. The retailer keeps a margin, but pays rent, staff, electricity and card fees out of it, and passes on the GST it collected to the government. The distributor pays freight, warehousing and interest on stock. The brand pays factory wages, power and component suppliers. If the panel or chips are imported, part of the money leaves India. No single business earns ₹50,000, and profit is whatever each one has left after costs.
| Who Earns From Festive Purchases | |
|---|---|
| Purchase | Who earns along the way |
| Sweets and packaged food | Dairy farmers, sugar mills, food processors, packaging firms, sweet shops |
| Flowers | Growers, commission agents, wholesale markets, transporters, street vendors |
| Gold jewellery | Importers, refiners, artisans, jewellers, lenders |
| Vehicles | Component makers, carmakers, dealers, lenders, insurers |
| Electronics | Component suppliers, assemblers, brands, distributors, retailers, EMI lenders |
| Clothes and home goods | Textile mills, tailors, artisans, wholesalers, retailers, delivery workers |
| Travel and hospitality | Airlines, railways, hotels, restaurants, taxi drivers |
The government's share flows through GST. Gross GST collections were ₹12.46 lakh crore in April to September 2026, 11.6% more than a year earlier, according to GSTN. GST covers all formal business activity, so this is not a festive spending figure, but it shows how much of every transaction reaches the public purse.
The Informal Festive Economy
Much of the festive rupee reaches businesses that never publish results. MoSPI's Annual Survey of Unincorporated Sector Enterprises counted 7.92 crore such establishments in 2025, employing 12.81 crore workers. Only 13.36% of them employ hired workers. Trade alone had 2.42 crore establishments, and its gross value added rose from ₹6.24 lakh crore in 2023-24 to ₹7.29 lakh crore in 2025.
These are the sweet shops, flower sellers, tailors, decorators and repair shops that festivals depend on. India grew 3,226.20 thousand tonnes of loose flowers in 2024-25, according to APEDA, the kind used in garlands and puja. The survey cannot show how much extra these businesses earn in festive weeks, but it shows how large this part of the chain is.
Which Industries Benefit Most
Gold is a classic festive purchase, and electronics are among the fastest growing. The table shows how demand, prices and imports for both changed over the past year.
| Gold and Electronics Indicators | ||
|---|---|---|
| Indicator | Period | YoY change |
| Gold jewellery demand, by weight | April to June 2026 | -15.4% |
| Gold jewellery demand, by value | April to June 2026 | +34.4% |
| Average gold price | April to June 2026 | +59% |
| Electronic goods imports | September 2026 | +51.49% |
| Gold imports | September 2026 | -81.27% |
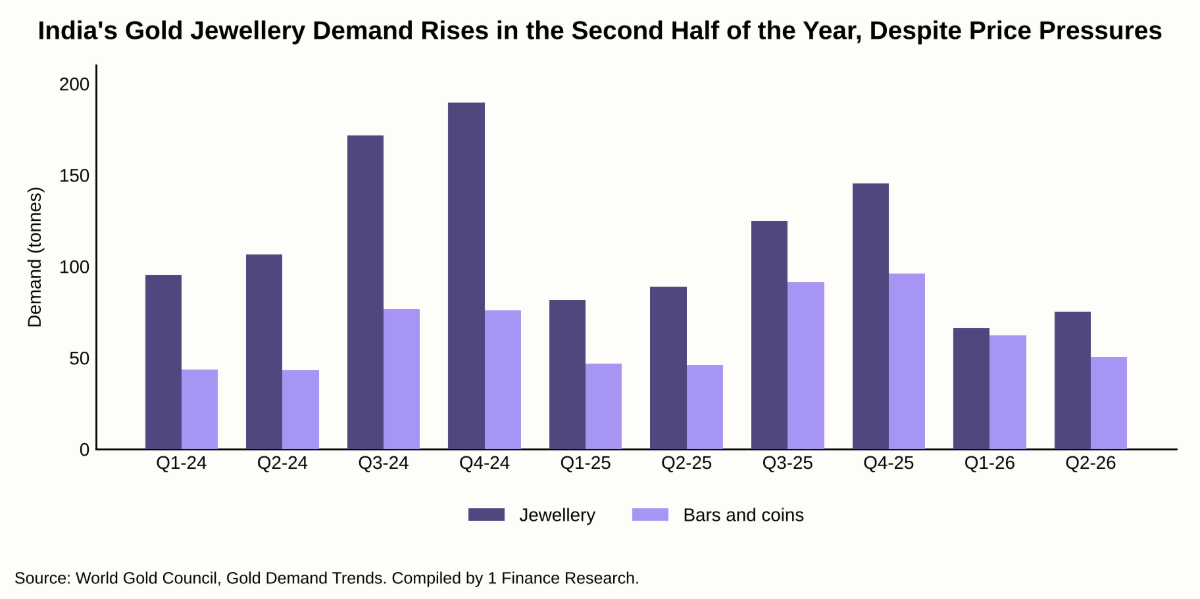
Gold. Indians bought 15.4% less jewellery by weight in April to June 2026 but spent 34.4% more, because the average gold price rose 59% to ₹1,50,733 per 10 grams. The World Gold Council (WGC) said on 20 October 2026 that listed jewellers' July to September revenue grew 20% to 30% as shops restocked.
Jewellery demand rises in the second half of most years, when festivals and weddings overlap.
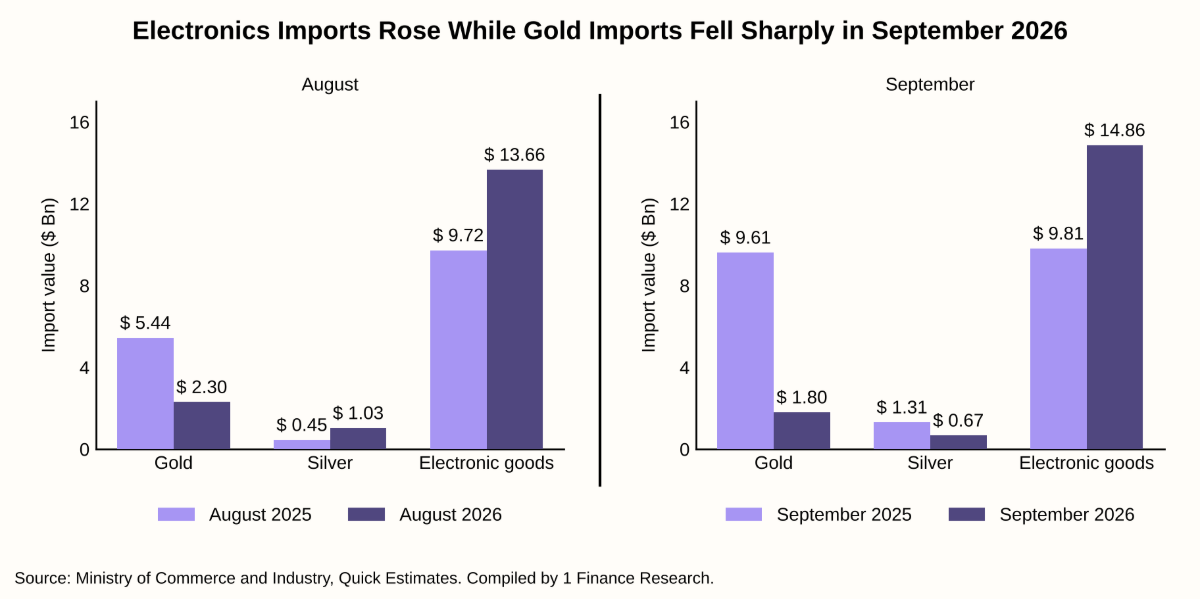
Silver and electronics. Silver imports more than doubled to $ 1.03 billion in August 2026, then fell 49.11% to $ 0.67 billion in September. Electronic goods imports rose to $ 14.86 billion in September from $ 9.81 billion. Import values show where supply is heading, not what households bought.
The table compares July to September 2026, the quarter when shops stock up for festivals, with a year earlier.
| Revenue and Profit Growth, July to September 2026 | |||
|---|---|---|---|
| Industry | Company | Revenue YoY | Net profit YoY |
| Automobiles | Maruti Suzuki | +26.1% | -26.9% |
| Automobiles | TVS Motor | +44.0% | +52.0% |
| Electronics and appliances | Havells | +34.6% | +11.1% |
| Food and consumer goods | Nestlé India | +20.5% | +36.3% |
| Food and consumer goods | Tata Consumer | +14.0% | +16.0% |
| Apparel and retail | Trent | +23.0% | +9.0% |
| Apparel and retail | DMart | +17.8% | +8.5% |
| Home improvement | Asian Paints | +16.9% | +7.5% |
| Travel and hospitality | Indian Hotels | +21.0% | +23.0% |
Note: Against July to September 2025. Havells, Nestlé India and Trent are standalone; Tata Consumer, DMart, Asian Paints and Indian Hotels are consolidated. Maruti Suzuki shows net sales. Trent's year-ago profit included a one-off gain.
Inflation, Costs and Profits
Retail inflation (CPI) tracks what you pay in shops. Wholesale inflation (WPI) tracks what businesses pay when they buy in bulk from producers. If retail inflation is 5%, a basket that cost ₹100 a year ago now costs ₹105.
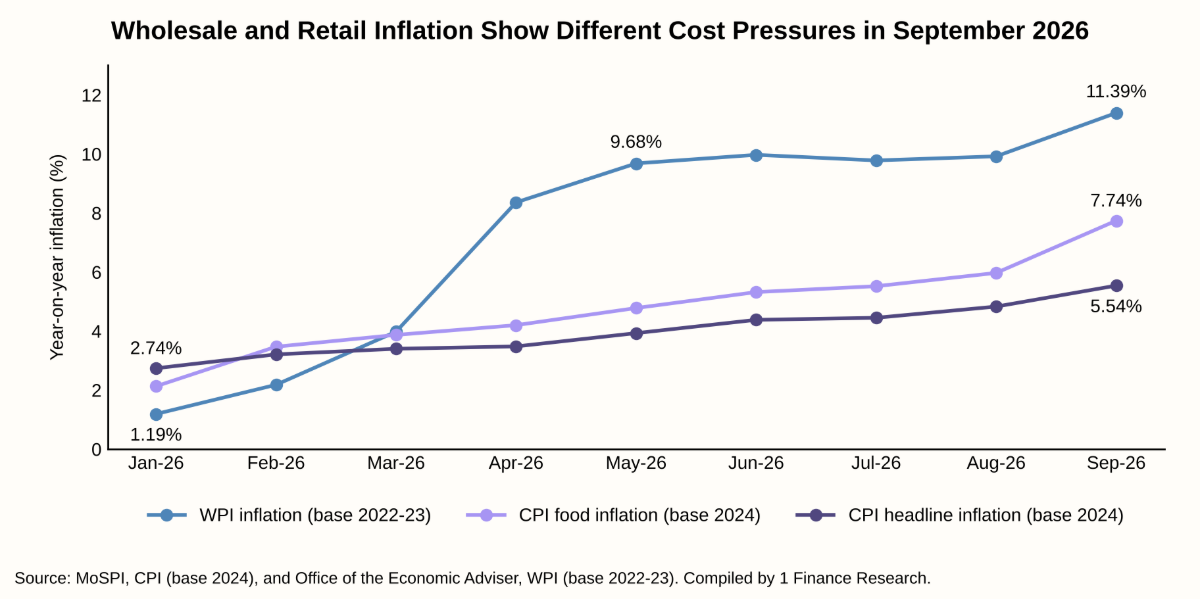
In September 2026, retail inflation was 5.54%, food inflation 7.74% and wholesale inflation 11.39%. The two indices cover different baskets, so the gap does not measure margins directly, but it signals that input costs are rising faster than shop prices. The RBI survey gives a selling price score of 28.4 for October to December 2026, meaning far more firms expect to raise prices than cut them.
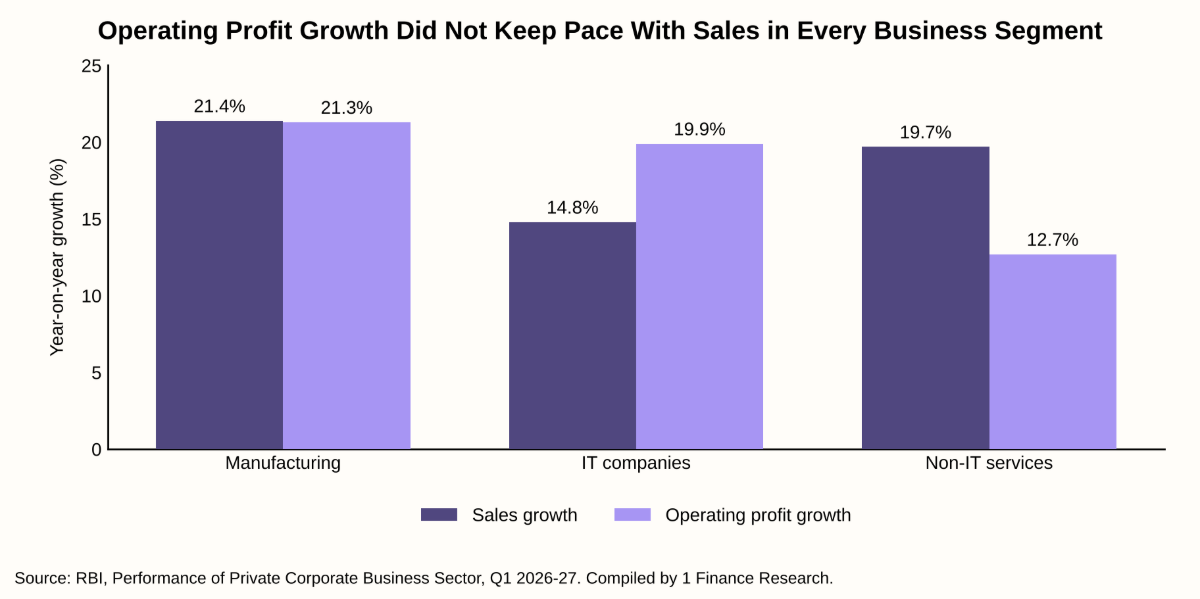
Non-IT services companies grew sales 19.7% but operating profit only 12.7%. Net profit can diverge further, because it also absorbs interest and one-off items. Maruti Suzuki is the clearest case. It sold a record 6,96,654 vehicles in July to September 2026 and grew net sales 26.1%, yet its net profit fell 26.9%, which the company linked to commodity costs and investment losses.
What Happens After the Festival
After Diwali, the chain unwinds. Retailers clear leftover stock through discounts. Distributors collect payments from shops and repay suppliers and banks. Factories adjust production to what is actually sold, and temporary jobs end. For flowers and sweets, the peak lasts days. For jewellery, clothes and hotels, the wedding season keeps demand going into early 2027.
Conclusion
Festive spending is not money earned by any one business. It passes through retailers, distributors, factories, suppliers, workers, lenders and the government, and part of it leaves India through imports. In 2026, that chain is carrying heavy stock, fast-growing credit and rising costs. Whether the festive rupee ends as profit depends on how much stock sells at full price.