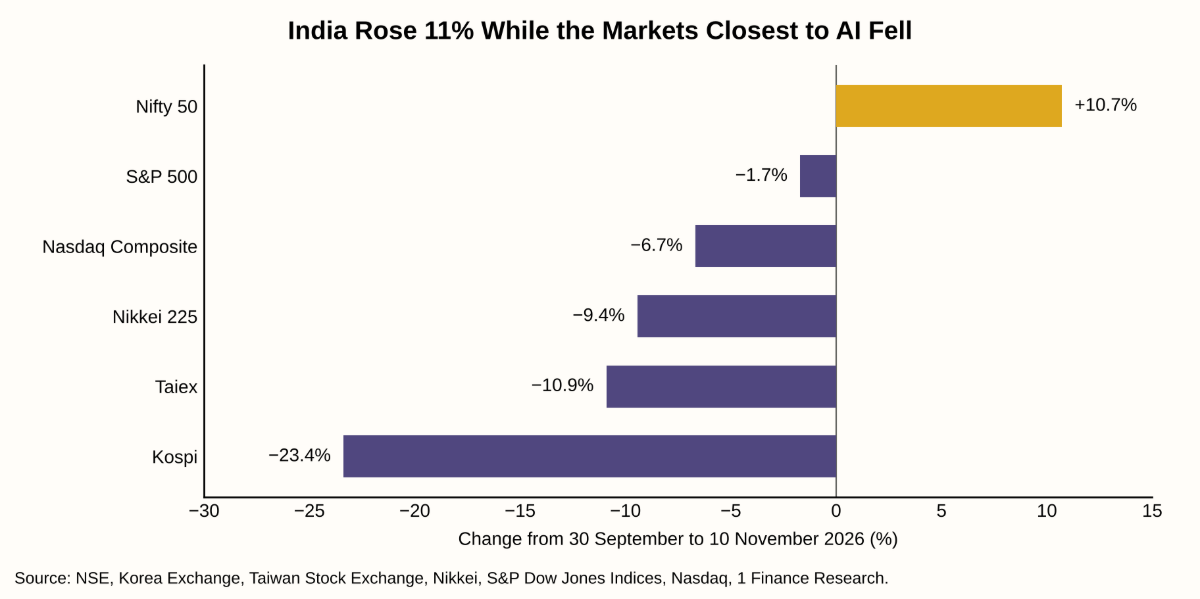
The past seven weeks have been one of the roughest stretches for the AI trade since the boom began. The 47 biggest US AI and chip stocks lost about $5 trillion in market value in the four weeks from 6 October, while the rest of the US market gained, and Korea's Kospi lost 16%. On 5 November, after the US midterms, the Nasdaq Composite had its worst day since April 2025. Then on 9 November, the Nasdaq 100 rose 3.4% in a day.
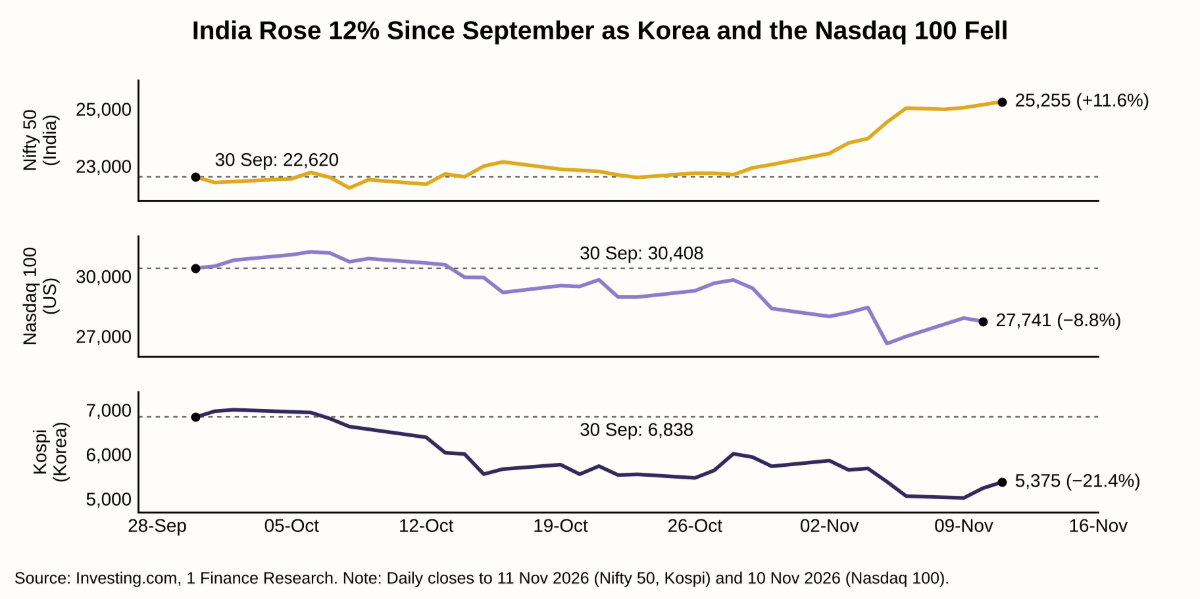
India has moved the other way. From 30 September to 11 November, the Nifty 50 rose 11.6% while the Kospi fell 21.4%.
So is the AI bubble bursting? Our answer is that it has sprung a leak. Investors have become less willing to pay for AI growth and to fund it on easy terms, while the spending itself is still accelerating. That split matters, because bubbles burst for good when the spending behind them is cut. Our base case is a slow, volatile digestion over the next year, with a one in four chance of a full bust. Nvidia's results on 18 November, two days after this edition, will be the next hard test.
Key Takeaways
|
There Are Two AI Bubbles, and Only One Has Cracked
Most of the debate treats AI as one bubble that either holds or bursts. We think it helps to separate the two.
The first is the investment cycle, the real spending on chips, data centres, power and cloud capacity. It shows up in capex plans, Asian export data and chipmakers' results, and on every one of those measures it is still accelerating.
The second is the financial cycle, what investors will pay today for the profits that spending is meant to produce, and on what terms they will fund it. It shows up in share prices, bond spreads and IPO pricing, and it has cracked since October.
In 2000, the financial cycle broke first, and the investment cycle followed about a year later. The question for the next twelve months is whether that happens again, or whether spending keeps growing long enough for returns to catch up.
The Spending Keeps Rising While the Cash Runs Short
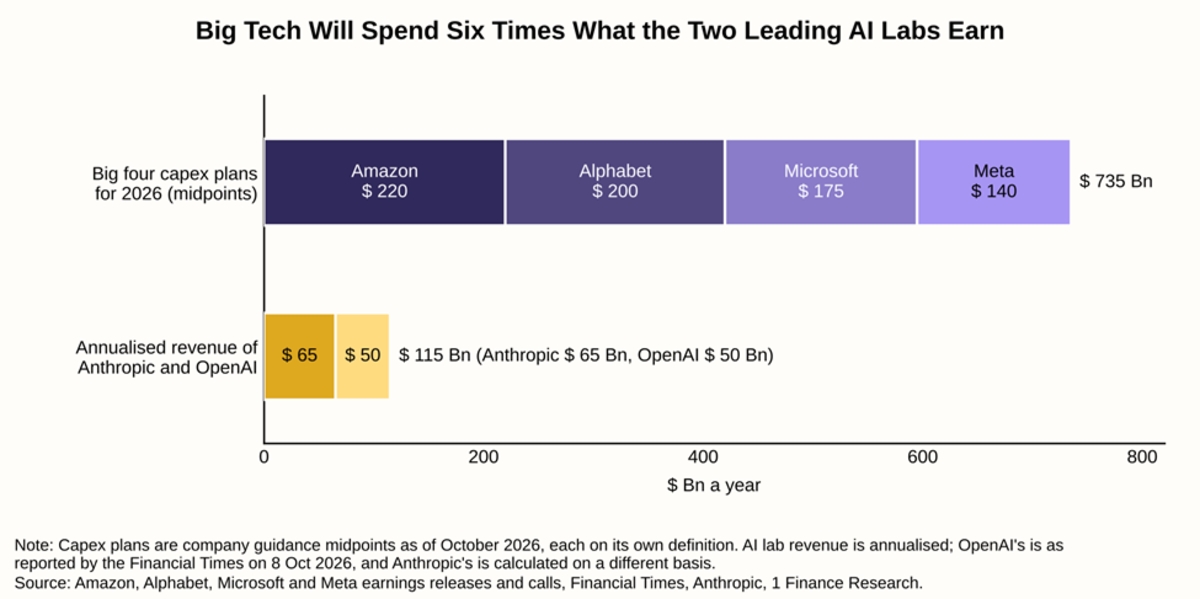
The four largest US hyperscalers, Amazon, Alphabet, Microsoft and Meta, went into results season planning $720 billion to $745 billion of capex in 2026. Nothing in their October results pointed to a cut. Meta raised the bottom of its range, and Amazon held its $220 billion plan and said it will spend "meaningfully more" in 2027.
What the results did show is how the spending is being paid for. In the third quarter alone, the four spent $202 billion on capex, about double a year earlier. Only Microsoft still covers its spending from operating cash flow.
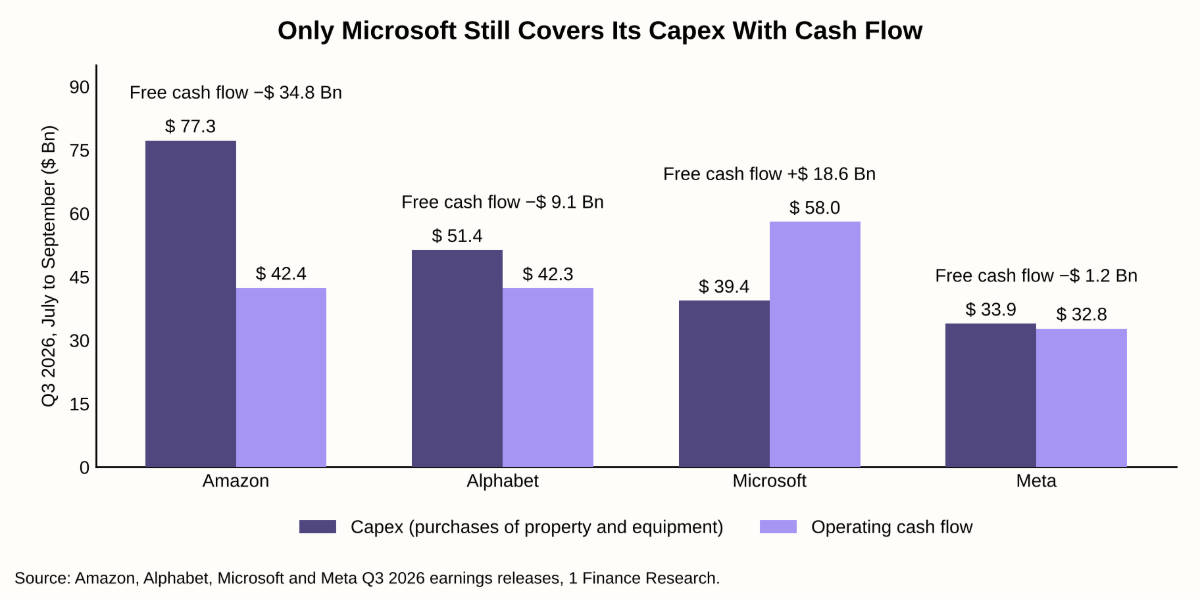
Alphabet shows why markets reacted as they did. Revenue rose 25% and Google Cloud grew 103%, yet the shares fell nearly 13% on 29 October, their worst day since listing, because capex hit a record and free cash flow turned negative.
So the next phase of the AI trade will be decided less by how many chips get sold and more by the return each dollar of spending earns.
Korea and Taiwan Are at a Record, and Their Markets Are Pricing the Peak
If AI spending were slowing, Korea and Taiwan would show it first, because they make the chips and servers the capex buys. Their trade data says the opposite.
| Measure | Latest | What it tells us |
|---|---|---|
| Taiwan exports | $96.8 billion in October, up 58.9%, a third straight monthly record | Servers and other ICT products rose 73% to $47.6 billion |
| Korea chip exports | $56.4 billion in October, up 259% (flattered by a holiday a year earlier) | Above $50 billion for a second month; all of 2018, the last peak, was about $127 billion |
Their stock markets have gone the other way. The Kospi peaked in June and is now about 41% below that high, after a 16.2% fall in October that included a 7.6% drop on 15 October. Taiwan's Taiex had its worst October on record.
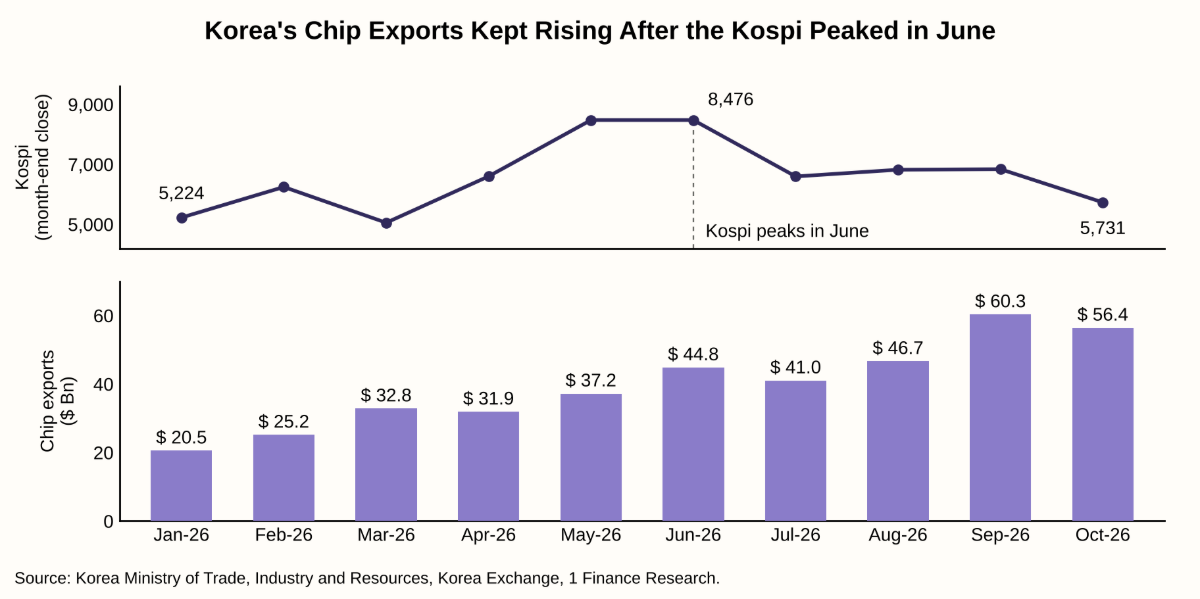
Chip stocks usually price in the turn well before it shows up in exports, and this boom has three late-cycle features.
- The growth is mostly price. Samsung's DRAM prices rose about 20% in the third quarter while volumes grew in low single digits, and price-led booms reverse faster.
- Everyone is adding capacity. Samsung plans about ₩84 trillion of capex this year, and TSMC will more than double its 2nm capacity next year.
- The shortage talk is loud. SK Hynix says demand will exceed supply through 2030. The 2018 boom was also called a supercycle, and Korea's chip exports fell 25.9% in 2019.
Long-term contracts make a 2019-style collapse in revenue less likely this time. They do not stop share prices from falling first.
China Has Shown What a Deflating AI Bubble Looks Like
For a preview of the financial cycle cracking, look at Shanghai. The STAR50, China's index of tech and chip companies, has fallen 41% from its 30 June peak, wiping out about $480 billion of value. Three features of that fall may repeat elsewhere.
- There was no single trigger. Prices had run too far, and new buyers stopped arriving.
- The newest listings fell hardest. GPU makers Moore Threads and MetaX have halved since July.
- A big fall does not make a market cheap. The STAR50 still trades at about 100 times trailing earnings, down from nearly 250 at its peak. The Nasdaq 100 trades at about 30 times.
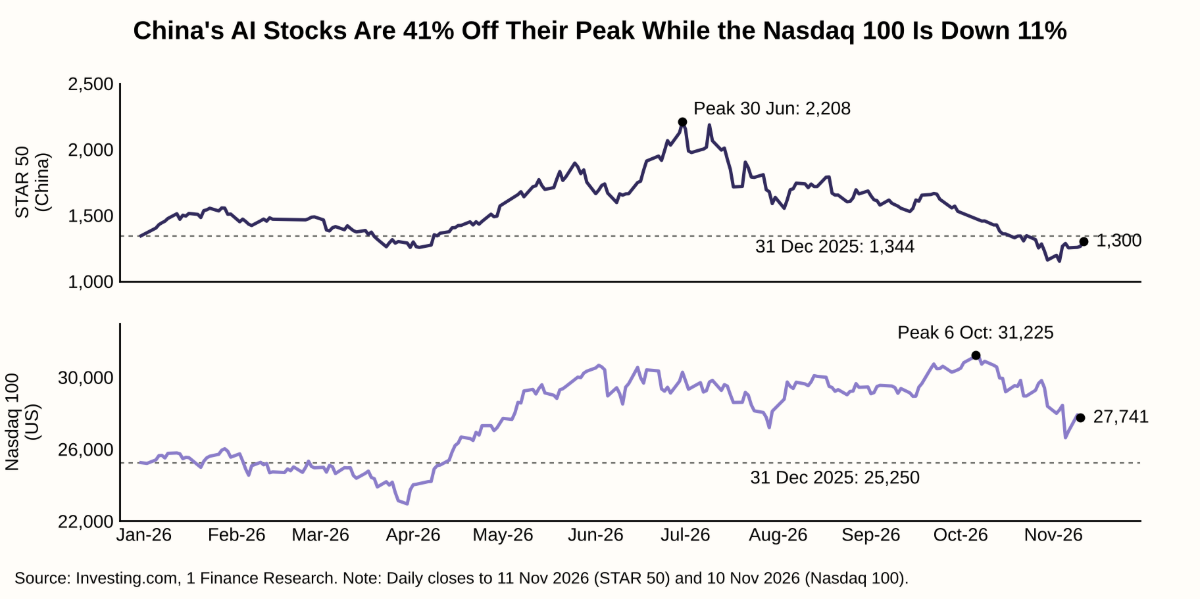
That valuation gap is the useful lesson. US AI stocks are expensive but nowhere near Chinese levels, which is one reason we expect a grinding reset there rather than a collapse.
The Funding Loop Is Starting to Show in Credit Markets
For most of the boom, big tech paid for AI out of its own profits. A growing share of the build-out now depends on outside money, and much of that money circulates within the AI industry itself.
The loop works like this. Chipmakers invest in AI developers. The developers use that money to buy computing capacity, much of it running on the same companies’ chips. Cloud providers borrow to build data centres and lease them to the developers. Each step books revenue and contracts that justify the next round of investment.
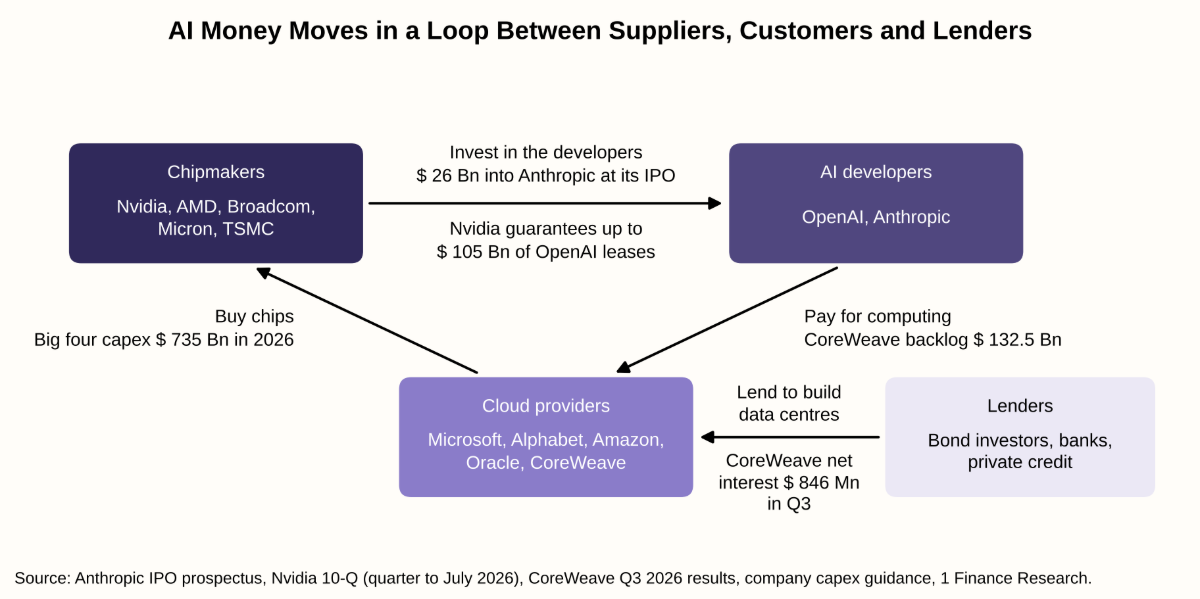
Anthropic's IPO filing on 10 November shows how tight the loop has become. Google, Nvidia, AMD, Broadcom, Micron, Microsoft and TSMC have agreed to buy $26 billion of its shares, and every one of them sells Anthropic chips or computing. In August, Nvidia guaranteed up to $105 billion of lease payments on a data-centre campus built for OpenAI. Outside investors are more cautious. OpenAI has secured about $11 billion of a round that originally targeted $30 billion, and has cut the target to $20 billion.
The credit market is where that caution shows first.
| Borrower | What has happened | Why it matters |
|---|---|---|
| CoreWeave | Five-year credit default swaps above 1,289 bps on 5 November; its 2032 bond yielded above 16% on 6 November; Q3 net interest of $846 million against operating income of $207 million | The most debt-dependent business in the chain, profitable before interest and loss-making after it |
| Oracle | Five-year credit default swaps at a record 288 bps in mid-October; about $125 billion of borrowings | The largest borrower building data centres on contracts with AI developers |
| Amazon, Alphabet, Meta | Credit default swaps at record-wide levels, though still low in absolute terms; Amazon issued $48.1 billion of long-term debt in Q3 | Even the strongest balance sheets now need outside money |
CoreWeave's demand is real, with its backlog more than doubling to $132.5 billion. The question is whether it can keep borrowing on these terms until that backlog turns into cash. None of these companies has missed a payment, and wider spreads do not mean default. But credit stress usually starts this way, with lenders telling business models apart instead of funding the whole ecosystem on the same terms.
AI Is Earning a Lot, Just Not Enough Yet
The bubble question comes down to payback, meaning how much extra operating profit each extra dollar of capex produces. Today AI earns a lot, and still far less than it costs.
The cloud businesses are growing fast. In the quarter to September, Google Cloud revenue rose 103% to $30.7 billion, Azure grew 48%, and AWS grew 39% to $46.0 billion.
The model makers tell a less comfortable story. On 8 October, the Financial Times reported OpenAI's annualised revenue at about $50 billion, roughly $20 billion below the figure widely reported. Anthropic reports about $65 billion, on a different measure. Together, the two labs bring in about $115 billion a year, and the big four will spend more than six times that on capex in 2026. Anthropic's IPO price range implies a valuation of about $1.2 trillion to $1.3 trillion, against the $2 trillion discussed in early October.
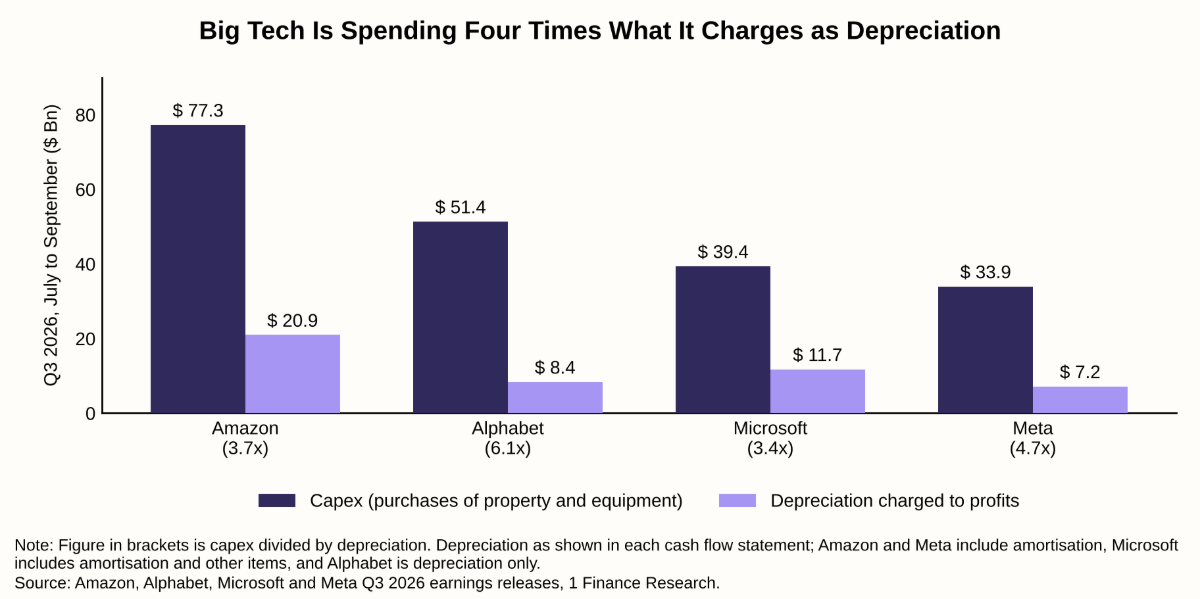
Depreciation is where the return will be tested. Capex is paid in cash today but charged against profits over five to six years for servers. In the third quarter, the big four spent $202 billion on capex and charged $48 billion of depreciation, a ratio of more than four to one, and six to one at Alphabet. Silicon Analysts estimates that spending in the four quarters to March 2026 alone will add $65 billion to $75 billion a year to depreciation, or up to $110 billion if servers last four years instead of six.
That assumption matters. Between 2022 and 2025, all four lengthened the expected life of their servers to five and a half or six years, lowering reported depreciation by about $3 billion to $4 billion a year each. Amazon has since shortened part of that back to five years. Critics such as Michael Burry argue that AI chips become economically obsolete in two to three years. If they are right, today’s AI profits are overstated, and the bill arrives in 2027 and 2028, after the money has been spent.
The Midterms Added a Political Risk to the Build-Out
Until this month, only money and demand could slow AI spending. The 3 November midterms added permission.
Democrats won control of both chambers of Congress, with 254 House seats and at least 52 Senate seats as of 11 November. Voters in 13 states weighed in on data-centre measures. In Texas, one of the biggest data-centre markets, governor-elect Gina Hinojosa has pledged to pause new data-centre approvals until new rules are in place. She takes office in January.
On 5 November, the Kospi closed 5.3% lower, and the Nasdaq Composite fell 5.5% as investors priced in tougher rules on AI and data centres. The Nifty rose 2.4% the same day.
New rules take time to pass. But they offer a way spending could slow without any fall in demand, leaving chips, contracts and debt already committed to take longer to start earning.
Three of the Six Warning Signs From 2000 Are Flashing, and Credit Is Next
The dot-com bust is the closest precedent, because it too was built on a technology that changed the economy. What failed were the spending plans and financing around it. The Nasdaq peaked on 10 March 2000 and fell about 78% by October 2002. Share prices went first, telecom capex collapsed in 2001, and the debt went bad in 2002. We use that sequence as a scorecard.
| Warning sign | Dot-com bust, 2000 to 2002 | Now | Flashing? |
|---|---|---|---|
| Valuations break | Nasdaq 100 at about 104 times earnings at end-1999, an estimated 150 to 200 times at the peak | Nasdaq 100 11% off its record at about 30 times earnings; STAR50 down 41%; Anthropic's IPO price range below October talk | Yes |
| Funding strain | Lucent and Nortel lent to their own customers | Three of the big four spending more than their cash flow; chipmakers funding their own customers | Yes |
| Money gets tighter | Six Fed hikes from June 1999 to May 2000, to 6.5% | Fed hiked in September; futures fully price a December hike | Yes |
| Credit stress | Telecom defaults, ending with WorldCom in 2002 | Record default insurance costs at CoreWeave and Oracle; no defaults | Starting |
| Spending is cut | Telecom capex collapsed in 2001 | Capex plans still rising for 2026 and 2027 | No |
| Demand dries up | Fibre laid in the boom sat unused for years | Taiwan's exports at a record; Korea's chip exports near one | No |
The three flashing signs are the ones that break share prices, as they did in 2000. The two that are not, spending cuts and collapsing demand, turned the 2000 correction into a three-year bust. That is why we read the past seven weeks as a leak in the financial cycle, with the investment cycle intact.
One warning against complacency. In 2000, share prices fell about a year before capex did, and investors who waited for spending cuts or defaults were late. Tight money worries us most. The 10-year US Treasury now pays more than 5%, the rate every AI company's future profits have to beat.
We Expect a Volatile Digestion Over the Next Twelve Months
Our base case is that AI spending keeps growing more slowly and investors get more selective.
| Next 12 months | Probability | What happens |
|---|---|---|
| Digestion | 50% | Capex growth slows, valuations reset 15% to 25%, credit stress stays at the weakest borrowers |
| Full bust | 25% | A hyperscaler cuts capex outright, a data-centre borrower runs into refinancing trouble, chip demand contracts |
| Re-acceleration | 25% | AI revenue catches up with capex, and October looks like a buying opportunity |
Why digestion? Demand for computing is real, and the biggest spenders are still very profitable. A valuation reset does not need the technology to fail, only for investors to pay less today for profits expected years from now.
We would move towards a bust if a hyperscaler cut its capex plan, if credit stress spread beyond CoreWeave and Oracle, or if Korea's chip exports started falling. We would move towards re-acceleration if Nvidia's guidance and Anthropic's IPO both come in strong and US inflation cools.
India Is a Bystander This Time
In September, in India Is the Other Side of the AI Trade, we argued that India's lack of AI hardware companies cost it this year's rally but would protect it in a reversal. So far, it has. From 30 September to 11 November, the Nifty 50 rose 11.6% while the Kospi fell 21.4% and the Nasdaq 100 fell 8.8%. Foreign investors bought ₹38,971 crore of Indian shares in November up to 8 November.
A slow reset could help India in two ways. Money leaving expensive AI markets will look for cheaper ones, and foreign ownership of Indian equities is already low. And if AI borrowing slows, pressure on US long yields eases, which helps Indian government bonds. A sharp global selloff would hit the rupee and foreign flows before either benefit arrives. At home, the most exposed stocks are data-centre, power and electrical equipment companies valued as part of the global build-out.
For most Indian investors, the AI exposure sits in US and global funds, often concentrated in the same few names. Three points for advisors:
- Check the holdings, not the fund count. Three international funds can mean one AI bet held three times.
- Rebalance what has outgrown its weight. The AI rally and a weaker rupee have pushed many global allocations above target.
- Treat a reset as part of the plan. A 15% to 25% fall in AI valuations fits our base case and is a poor reason to give up long-term international exposure.
As long as the spending holds, we expect a long digestion rather than a bust, and India is better placed than most markets to come through it.