This Diwali, many client conversations will start with gold. It returned 75% in India in 2025 and silver more than doubled, while the Nifty 50 gained 10.5% and has since given back 11.8%. It is natural for clients to wonder whether they have missed out.
We think something larger is happening underneath. The relative price of opportunity across asset classes has shifted. At the end of 2024, a unit of the Nifty 50 bought roughly as much gold as it did in 2018. Today it buys about 44% less. Gold, silver and global equities now carry two years of gains, while Indian equities trade at 19.7 times earnings, a level the Nifty 50 has seen in only a few months over the past decade. What an investor pays for each asset class, relative to the others and to its own history, has been rearranged.
That shift, more than any single forecast, is what should guide where the next rupee goes. On balance, we would lean new money towards Indian large caps over the coming months and let gold settle back towards its target weight. The sections below trace how the price of opportunity has moved across each asset class, how we would act on it for different clients, and what would lead us to revisit this view.
Key Takeaways
|
The Year in One Table
| CY2021 | CY2022 | CY2023 | CY2024 | CY2025 | 2026 YTD* | 5-Year CAGR (CY2021–25) |
|---|---|---|---|---|---|---|
| BTC 62.1% | Gold 14.0% | BTC 156.7% | BTC 127.6% | Silver 167.7% | EMs 18.2% | BTC 30.0% |
| Smallcap 61.9% | Silver 10.2% | Smallcap 48.1% | Smallcap 26.4% | Gold 75.0% | DMs 16.3% | Silver 27.9% |
| Midcap 46.8% | Real Estate 9.9% | Midcap 43.7% | Midcap 23.8% | EMs 37.1% | Real Estate 8.8% | Midcap 23.2% |
| Lg Cap 25.0% | REITs & InvITs 9.1% | DMs 22.3% | DMs 20.5% | DMs 25.5% | Gold 5.5% | Smallcap 22.4% |
| DMs 22.2% | Debt 5.2% | Lg Cap 20.0% | Gold 20.4% | REITs & InvITs 25.5% | REITs & InvITs 5.1% | Gold 21.6% |
| REITs & InvITs 17.7% | Cash 4.8% | Gold 15.3% | Silver 16.9% | Real Estate 11.1% | Cash 4.3% | DMs 15.2% |
| Real Estate 10.8% | Lg Cap 3.6% | Debt 7.9% | REITs & InvITs 15.7% | Lg Cap 9.0% | Debt 4.2% | Lg Cap 13.6% |
| Debt 4.4% | Midcap 3.0% | Real Estate 7.8% | Real Estate 12.5% | Debt 7.7% | Smallcap 0.5% | REITs & InvITs 13.4% |
| Cash 3.3% | Smallcap −3.6% | Silver 7.8% | Lg Cap 11.8% | Cash 5.8% | Midcap −5.5% | Real Estate 10.4% |
| EMs −3.0% | DMs −10.3% | EMs 7.5% | Debt 8.3% | Midcap 5.4% | BTC −6.3% | Debt 6.7% |
| Gold −4.0% | EMs −13.5% | Cash 6.7% | EMs 8.2% | BTC −1.6% | Lg Cap −10.2% | EMs 6.0% |
| Silver −8.0% | BTC −60.1% | REITs & InvITs 0.8% | Cash 6.8% | Smallcap −6.0% | Silver −20.3% | Cash 5.5% |
The table below ranks twelve asset classes by return in each calendar year. The leader changed almost every year. Silver went from worst in 2021 to best in 2025, and is the worst performer of 2026 so far. Indian large caps never came first, yet never had a disastrous year either, compounding at 13.6% a year from 2021 to 2025.
Recommended for you
Readers also explored
World GDP Breakdown 2025: Who Powers the Global Economy?
 8 min read

Nifty 50 Companies List 2025 : Top 50 Stocks in India
7 min read
The practical lesson is less about picking the next winner and more about rebalancing. A portfolio that was simply brought back to its target mix each year would have trimmed silver and gold after their run and added to equities after their slide, which is roughly the position we would be taking today.
| How We Measure Each Asset Class | |||
|---|---|---|---|
| Abbreviation | Asset class | Index or source | Return basis |
| Lg Cap | Large cap equities | Nifty 100 | Price |
| Midcap | Mid cap equities | Nifty Midcap 150 | Price |
| Smallcap | Small cap equities | Nifty Smallcap 250 | Price |
| DMs | Developed market equities | MSCI World Index, converted to rupees | Price |
| EMs | Emerging market equities | MSCI Emerging Markets Index, converted to rupees | Price |
| Gold | Gold | BSE spot price, ₹ per 10 g | Price |
| Silver | Silver | BSE spot price, ₹ per kg | Price |
| BTC | Bitcoin | Bitstamp BTC/USD close, converted to rupees | Price |
| Real Estate | Residential property | 1 Finance Housing Total Returns Index (quarterly) | Total return |
| REITs & InvITs | REITs and InvITs | Nifty REITs & InvITs Total Returns Index | Total return |
| Debt | Debt funds | Equal-weight blend: ABSL Liquid, ICICI Pru Dynamic Term, ICICI Pru Short Term (Direct, Growth) | Total return |
| Cash | Cash | Nifty 1D Rate Index | Total return |
Gold's Supports Have Softened
Gold's buyers fall into two groups. Structural buyers are holding firm. Central banks bought 863 tonnes in 2025 and 675 tonnes so far in 2026, up 6%, as reserves shift slowly away from the dollar. Cyclical buyers are swinging. ETFs added 801 tonnes in 2025 as the Fed cut rates, then saw 45 tonnes of outflows in April to June and 211 tonnes of inflows in July to September as the Hormuz closure revived demand for safety. Price-sensitive buyers have stepped back. Jewellery volumes hit their weakest third quarter on record, and coin and bar buying fell 19%.
This suggests gold has become expensive less because its fundamentals improved than because investors are paying for safety. Gold usually falls when US real interest rates rise. Today the US 10-year real yield is about 2.7%, against roughly minus 1% in 2020, yet gold is far higher. That gap is a safety premium. It can last as long as the fears behind it, and central bank buying should limit the downside, but it can also shrink quickly, as gold's 9% one-day fall in January showed.
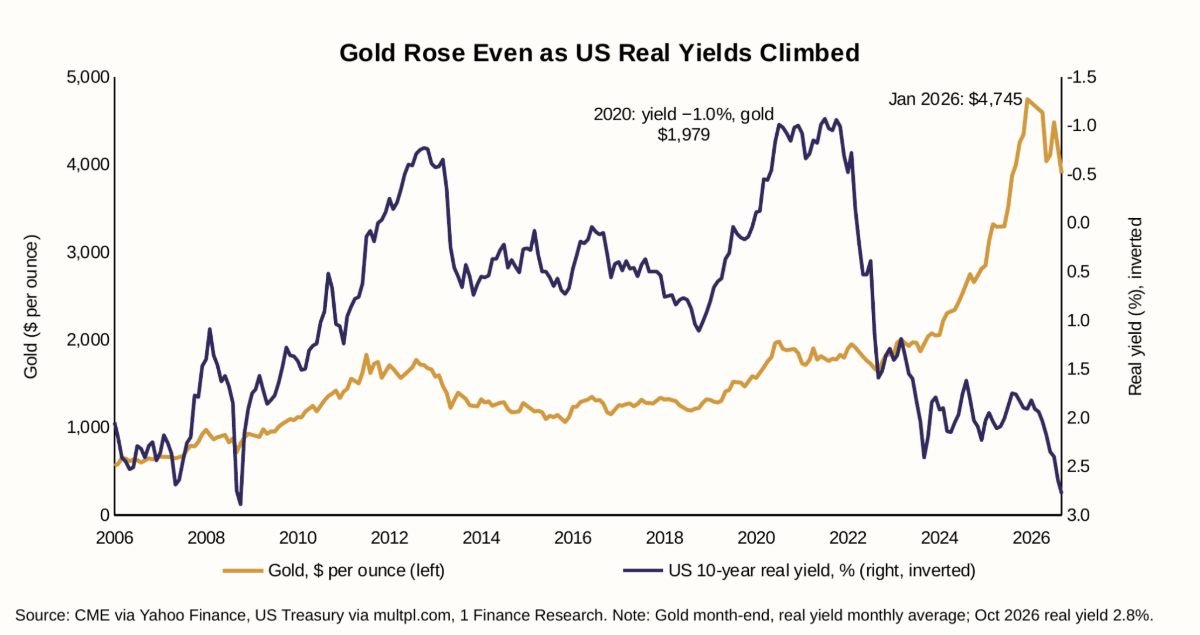
In rupees, gold is still about 81% above its end-2024 level despite an 18% fall from its January peak. Most of this year's 5.5% gain came from a weaker rupee and higher import duty, not from gold itself, which is down about 10% in dollars. We would hold gold at its target weight rather than keep adding to it.
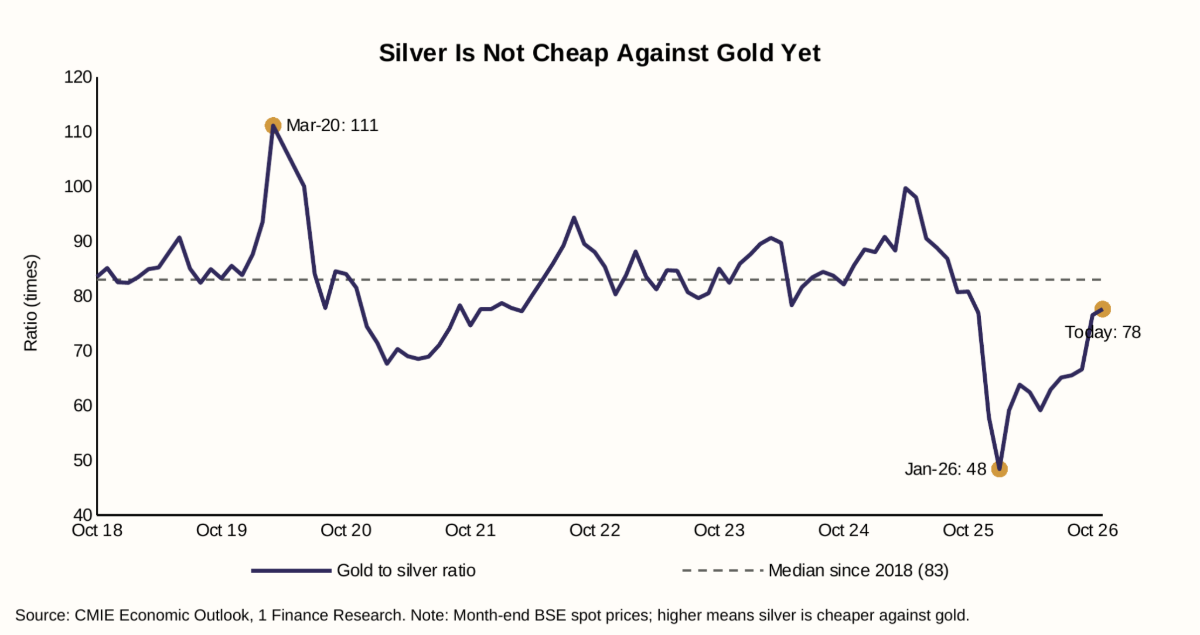
Silver is not yet the cheaper alternative. One way to judge silver is against gold. Dividing the gold price by the silver price gives a ratio that has usually sat around 83 since 2018; a high number means silver is cheap relative to gold. It reached 111 in March 2020, and silver went on to do much better than gold over the next year. It fell to 48 in January 2026, and silver has since dropped 47% against gold's 17%. At 78 today, silver is no longer stretched, but it is not cheap either. We would keep silver holdings small and would not switch gold into silver at this level.
Indian Equities Have Quietly Become Better Value
The economy is not the problem. GDP grew 7.8% in April to June 2026, and the IMF expects 7.0% growth this financial year. The pressure came from three other places.
- Profits. Nifty 50 earnings grew only about 5% in FY26, and after the oil shock, analysts cut FY27 growth forecasts from over 16% to about 9%.
- Foreign money. Foreign investors sold a record ₹1.66 lakh crore of Indian shares in 2025 and about ₹2.95 lakh crore more this year, drawn by high US yields and the AI rally in Korea and Taiwan. Their ownership of NSE-listed companies is at a 17-year low.
- Oil. Brent above $100 pushed the rupee to a record low and led the RBI to raise the repo rate to 5.50% in October.
Domestic investors held the line, buying about ₹6.2 lakh crore of shares this year, with monthly SIP flows at a record ₹32,490 crore in September. The result is a market that has gone almost nowhere in price while earnings kept growing. The Nifty 50 is about 1% below where it was two years ago, but its price-to-earnings ratio has fallen from 22.2 to 19.7, about 15% below its 10-year median of 23.1.
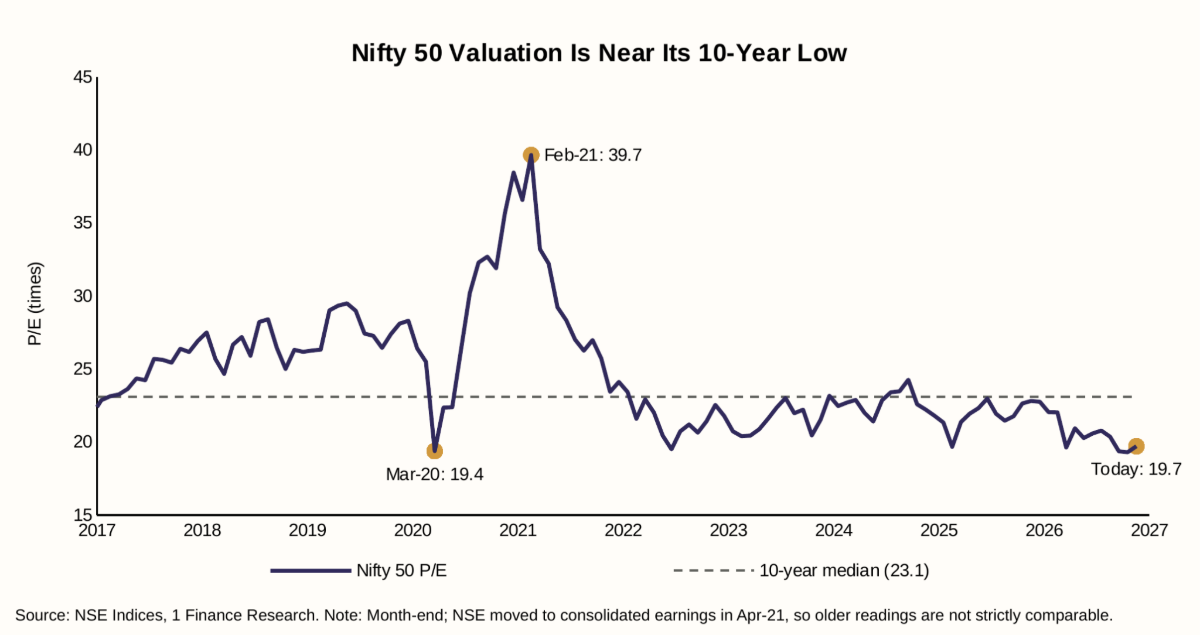
Valuations alone rarely set the timing. What would help is earnings. Early July to September results show profits up about 22%, and if that holds through the next two quarters, the market gets cheaper even if prices stay put. The risks are clear too: a longer Hormuz closure, further rate hikes, or another year of foreign selling. That mix argues for building equity exposure steadily rather than all at once.
Why This Is a Time to Average Into Equities
Pricing the Nifty 50 in gold shows the same shift from another angle. When the line rises, equities are doing better; when it falls, gold is. Since the end of 2024, the line has fallen 44%, and it now sits below its level at the bottom of the COVID crash. This is less about equities collapsing than about gold racing ahead.
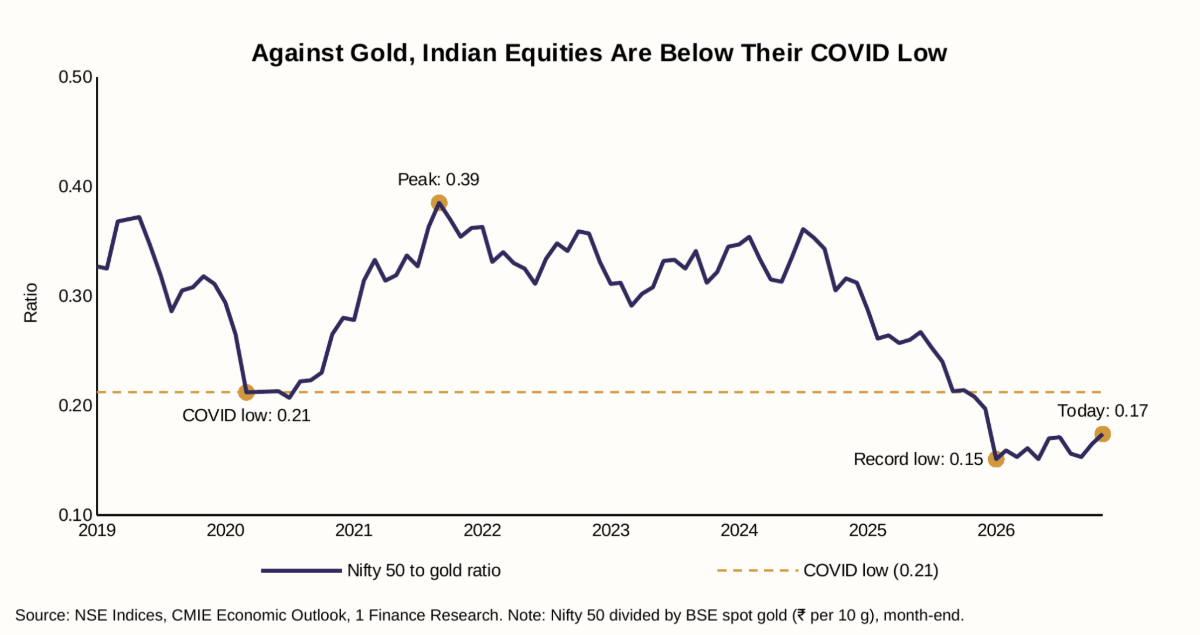
A single starting point can flatter either side, so it helps to look at every three years instead. The chart below compares the Nifty 50's annual return over each rolling three-year window with gold's.
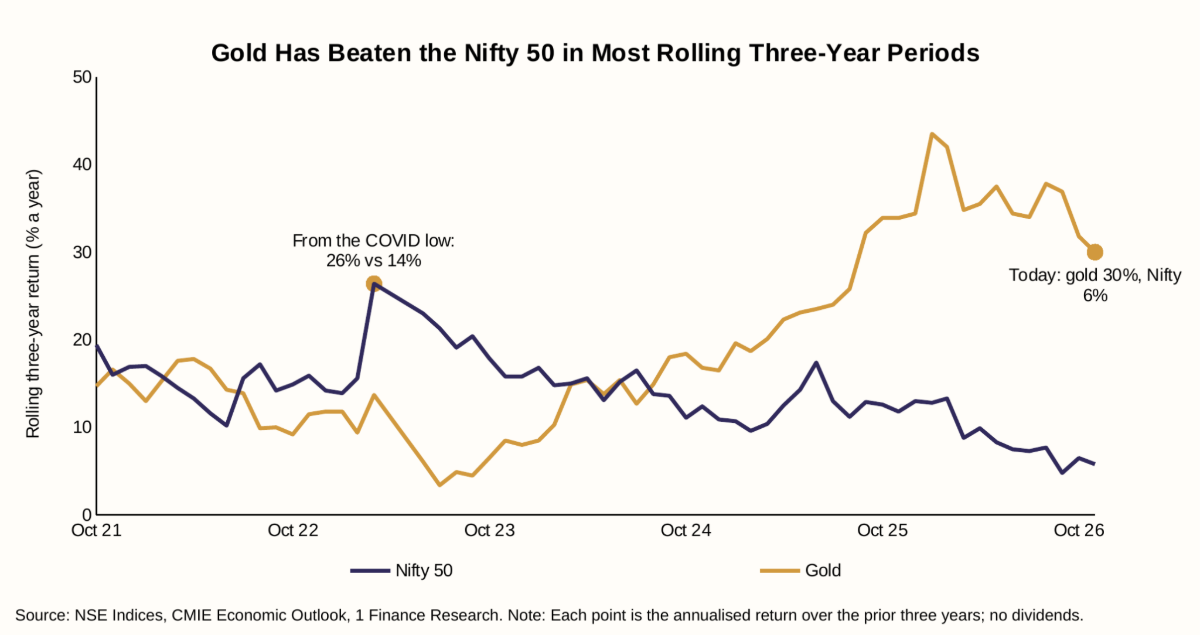
Three things stand out. First, gold has been the stronger asset over this stretch: across the 60 three-year windows since 2018, it beat the Nifty 50 in 35. Second, leadership has changed hands: the Nifty led in the three years after the COVID crash; gold has led since late 2024. Third, the gap is still close to the widest in the series: gold has returned 30% a year over the last three years against 6% for the Nifty, after peaking at 44% against 13% in January 2026.
That last point cuts both ways. It confirms how far gold has run, and it means gold's recent three-year returns rest on a starting point that cannot be repeated. It does not prove that equities will now catch up, and this history is short. It is why we prefer averaging over switching: directing new money and gold above target into equities over several months, rather than selling gold outright.
The Rupee Will Likely Matter Less Next Year
The rupee links most of what happened this year. It fell from ₹89.9 to ₹95.3 to the dollar between January and October, touching a record low near ₹97 in May as oil surged. That 6% fall changed what Indian investors earned on everything priced abroad. Gold fell about 10% in dollars but rose 5.5% in India. MSCI World gained about 10% in dollars but 16% in rupees.
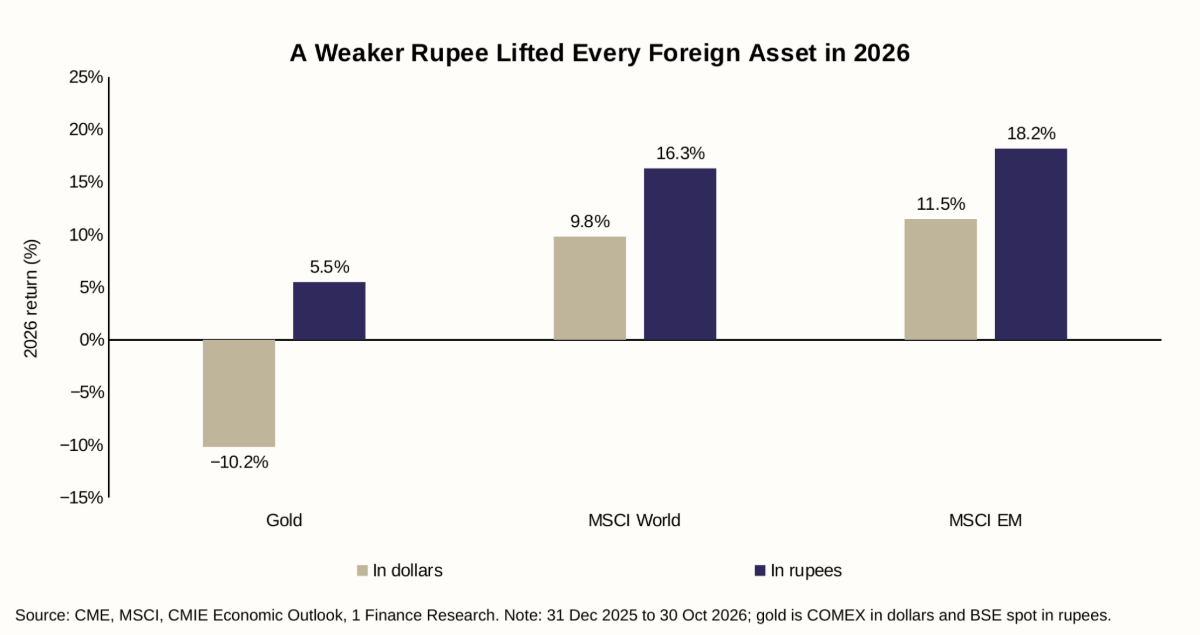
Much of the year ahead depends on oil and the Strait of Hormuz. We see three broad paths over the next twelve months, and each favours different assets.
| Scenario | Chance | What it assumes | Rupee by March 2027 | Rupee by September 2027 |
|---|---|---|---|---|
| Slower fall (base case) | 55% | Hormuz reopens gradually from March 2027; oil at $95 to $110 | ₹96 to ₹97.5 | ₹97 to ₹98.5 |
| Recovery | 25% | Hormuz reopens early in 2027; oil below $90; foreign money returns | ₹92 to ₹94 | ₹91 to ₹94 |
| Sharp fall | 20% | Hormuz stays shut into mid-2027; oil above $120 | ₹98 to ₹100 | ₹100 to ₹103 |
Two things stand out. First, in our base case the rupee adds perhaps 2 to 3 points to foreign assets over the next year, against about 6 this year, so the currency boost that flattered gold and global equities in 2026 is likely to be smaller. Second, the only path in which gold clearly does best is also the least likely one. Holding gold at target is the way to stay covered for it, without paying for it twice.
Global Equities Look Stretched Against India
Global equities are up 16% to 18% in rupees this year, while the Nifty 100 is down 10%. Part of the gap is real, with US company profits up about 30% last quarter on the AI boom. Part is the weaker rupee. Together they have pushed the S&P 500 to 84% above its usual 20-year level against the Nifty 50, and MSCI World to 51% above, both close to 20-year highs.
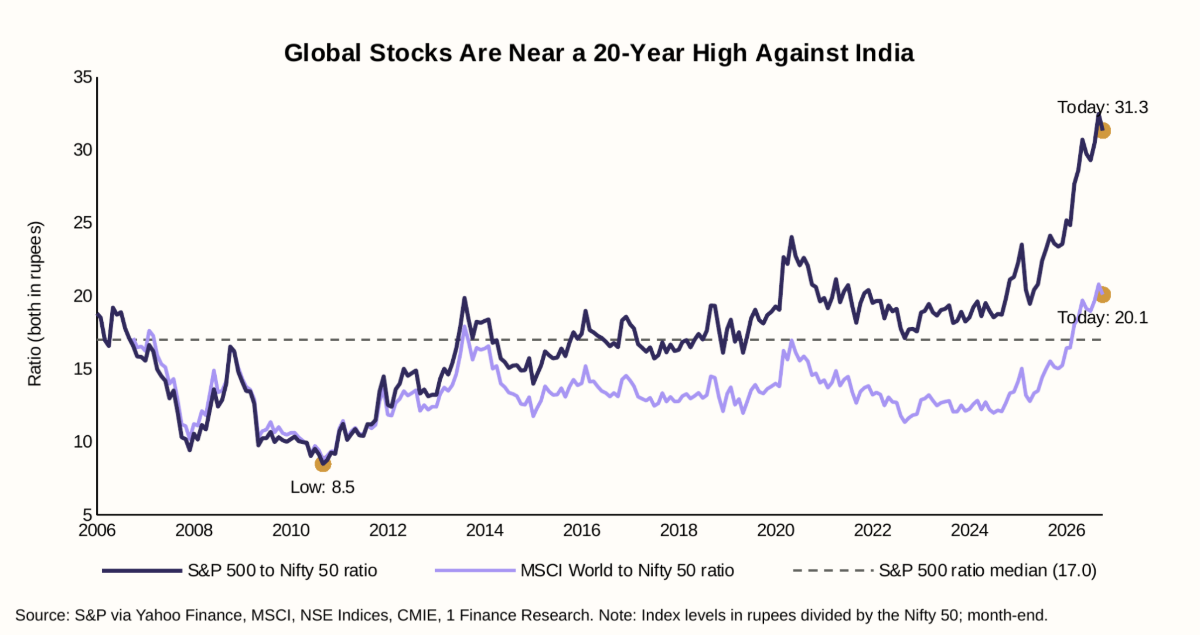
This measures one thing only: how global equities are priced relative to Indian equities. It does not say whether global equities are expensive in themselves, and the two questions have different answers.
Against their own earnings, US equities do not look stretched. The S&P 500 trades at 18.7 times expected earnings for the next twelve months, slightly below its 10-year average of 19.1 and its 5-year average of 19.8. That is because profits have grown even faster than prices: S&P 500 earnings rose about 30% in July to September, and analysts expect growth of about 33% for 2026 as a whole, much of it from the AI build-out. As long as that earnings lead holds, some premium over India is justified.
What has changed is the price of adding more. Part of this year's gain came from the rupee, and the base case gives a smaller currency boost ahead. Crowded themes can also reverse quickly: Korea's Kospi, up 76% in 2025, has since fallen almost 40% from its June peak. Global equities should remain an important diversification allocation, but their recent outperformance and currency contribution reduce the urgency to add fresh capital. We would hold them at target and trim only where they have grown well beyond it.
Where the Value Is Within Indian Equities
Mid and small caps led in 2023 and 2024, gaining 24% to 48% a year. Neither has gained more than 5.5% a year since, but their paths have split.
Mid caps have become better value. Their profits have grown about 3.6 times since April 2021, against 2.6 times for the Nifty 50, while prices have stalled. The Nifty Midcap 150 now trades at 26.9 times earnings, 14% below its own average since 2021, a discount similar to large caps.
Small caps have not reset. At 31.4 times earnings, the Nifty Smallcap 250 is 12% above its average, the only segment that is. Money keeps flowing in, with ₹9,039 crore going into small-cap funds in September even as the index fell. Small caps can also be slow to exit in a sell-off: AMFI's stress tests in May showed some of the largest small-cap funds would need up to two months to sell half their holdings.
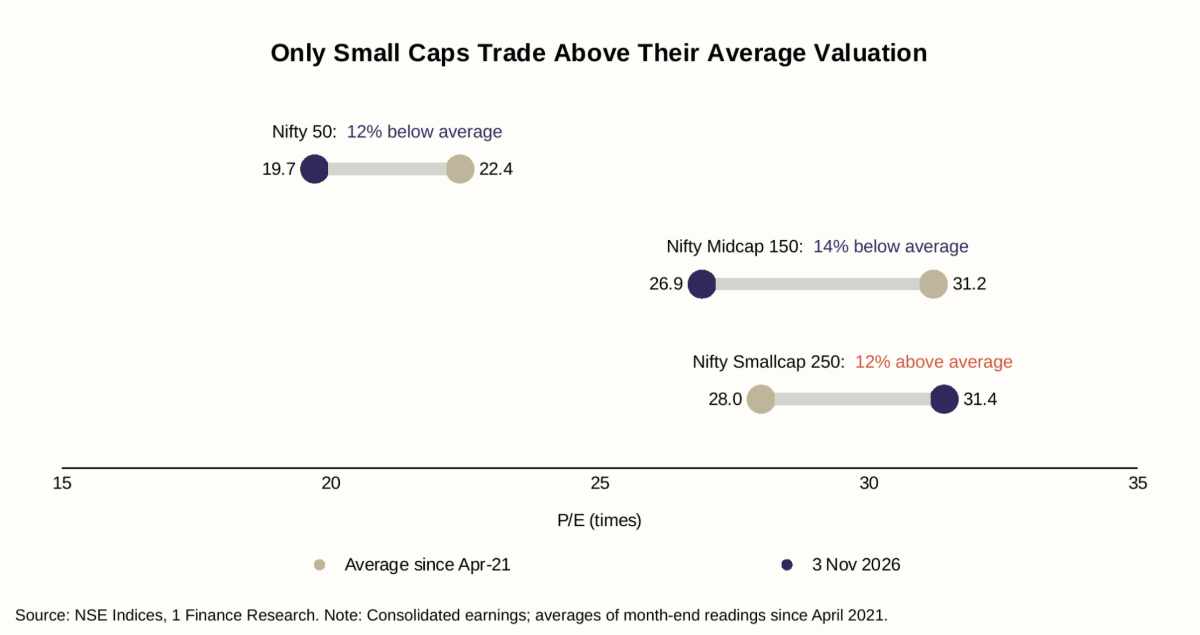
For new money, we would lean on large caps first, add mid caps steadily, and keep small caps to existing SIPs until valuations come back towards average.
What We Would Do With New Money
These are tilts within each client's strategic allocation, not switches between asset classes. The numbers below are working markers that advisors can adapt to each client.
| Asset class | Our view | What it means in practice |
|---|---|---|
| Large caps | Add | First choice for new money, built up over about six months |
| Mid caps | Add gradually | Start or step up SIPs; avoid lump sums |
| Small caps | Hold | Continue existing SIPs; no new lump sums for now |
| Gold | Hold at target | No new purchases; trim where well above target |
| Silver | Hold, keep small | No switching from gold at current levels |
| Global equities | Hold at target | No new money; trim only if well above target |
| Debt and cash | Stay mostly short | Use liquid and short-term funds to stage equity buying |
Clients heavy in gold. A client who started 2025 at 60% equity, 30% debt and 10% gold is now at roughly 53%, 30% and 17%. Where gold is more than 5 points above target, bring it back gradually:
- Sell gold ETF units held over 12 months first; gains are taxed at 12.5%.
- Keep sovereign gold bonds bought at issue, as they are tax-free at maturity. Since 1 April 2026, bonds bought on the exchange or sold early no longer qualify.
- Hold short-term units until they turn long-term.
Park the proceeds in a liquid fund and move them into large caps over six months. The aim is to correct drift, not to exit gold.
Clients with fresh money. Park it in a liquid fund and move it into equities over six months, about two-thirds to large caps and one-third to mid caps.
Conservative clients and retirees. Stay in short-term and liquid funds while rates are rising. If equity is below target, add through large-cap or hybrid funds over about twelve months.
Clients running SIPs. Keep them running and step up mid-cap SIPs. Redirect new small-cap instalments to large or mid caps only if small caps are above target.